1991issue C071-5
Trend as persistence, not a straight line
Common chart practice draws trend as an upward or downward line and skips the flat hold. This archive article treats trend as persistence, lets a trendline stay horizontal, pressure-tests that line with a walk-back linear-regression fit, and compares the result with a moving average that follows price without redrawing.
- Trend is persistence of price over time, including a stable horizontal level, not only an upward or downward slope.
- A trendline states direction or a sideways hold as a visual hypothesis; local dependence does not require that persistence be a straight line.
- Walking a linear-regression fit backward from the most recent 20 days treats a decline in the coefficient of determination as a sign that the added price is inconsistent with the current trend.
- A percentage filter sets which swing sizes count as trends, and a moving average follows price without requiring the analyst to redraw the line.
Persistence includes a flat hold
Common chart practice reduces trend to an upward or downward line and often omits a horizontal line as a description of persistence. Trend here means persistence of price over time, including a stable horizontal level, not only an upward or downward slope.
Day-to-day price continuity is presented as more typical of large or administered markets than of markets that regularly jump from one level to another. Local dependence, each print arriving near the last, does not by itself require that persistence be modeled as a straight line.
A trendline is a straight chart line used to state direction or a sideways hold. It is a visual hypothesis about path rather than a complete description of how prices actually travel.
A walk-back fit can fail
A linear-regression procedure can fit the most recent 20 days, then step one observation farther back at a time and treat a decline in the coefficient of determination as a sign that the added price is inconsistent with the current trend.
That regression view counts a persistent flat level as a trend just as it counts rising or falling prices. Movement can be defined as a departure from the fitted line or a sharp change in the line's slope or length.
Filter scale and a line that is not redrawn
A 6% percentage filter on the S&P 500 is used to erase smaller swings and thereby define only moves of that size or larger as the operative trends. The swing size a filter keeps also sets effective horizon: seeking a 6% wave implies ignoring 1% to 2% swings and working on a different scale from 10% to 25% swing definitions.
Moving averages are described as a non-discretionary extension of straight-line trend thinking because they follow price without requiring the analyst to redraw the line.
S&P 500 with a 6% swing filter
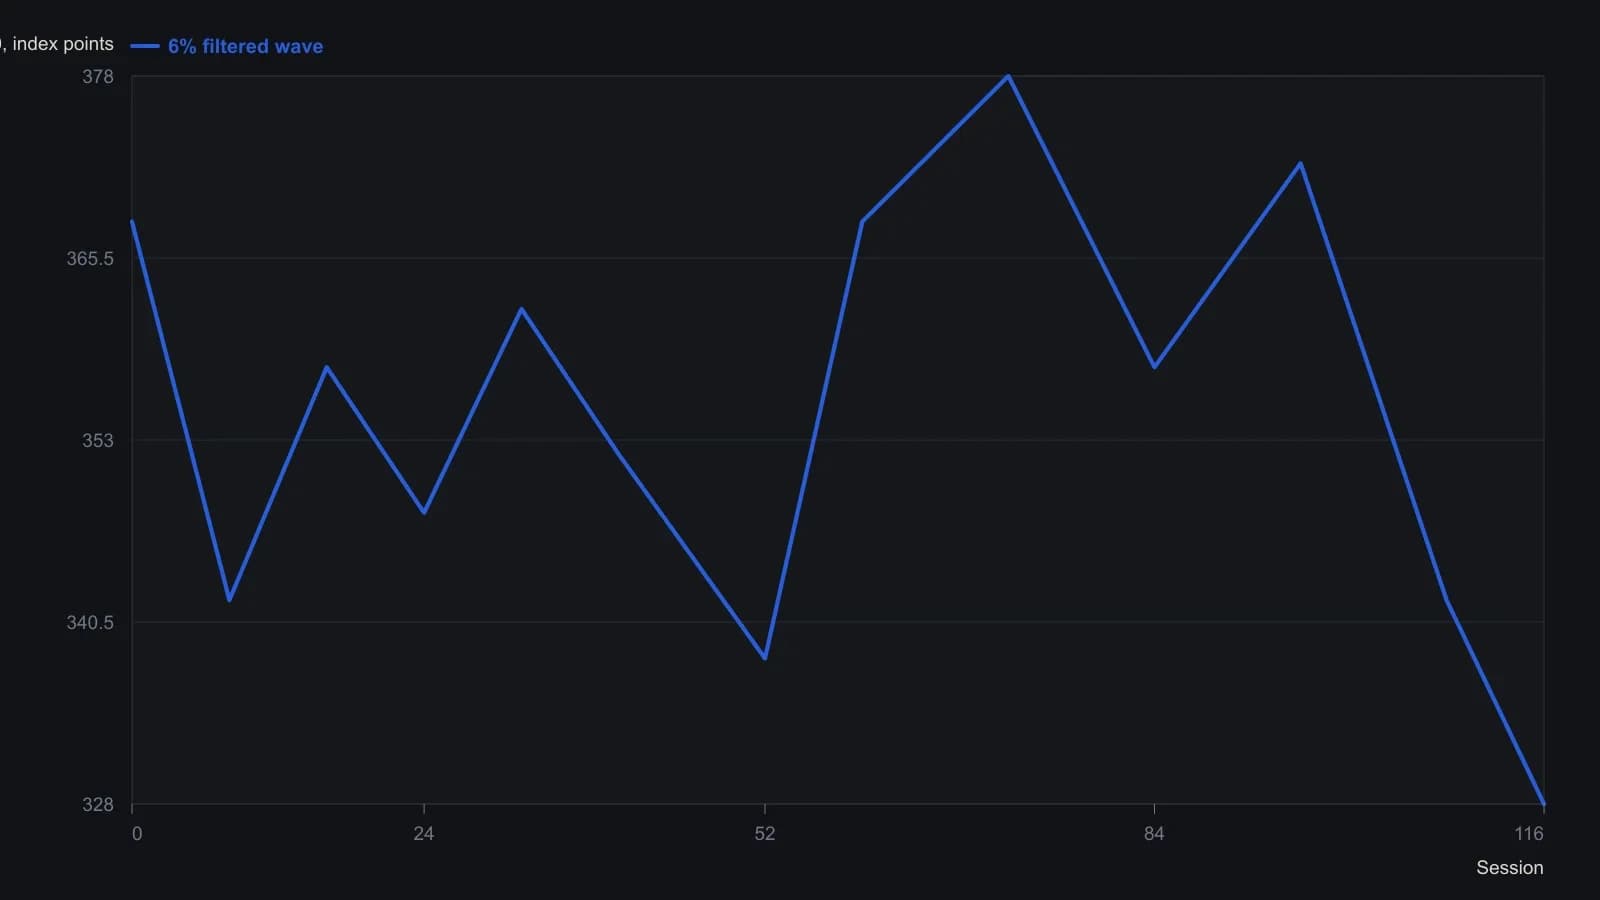
Sweeney’s own S&P scale is a 6% filtered wave; smaller 1–2% swings are dropped. Digitised from the printed chart, so turning points are approximate.
All readings on this track · 43 readings
- 1990Constructing dollar baselines from rates, inflation, and residuals
- 1990Constructing a nominal index value from forward earnings and fitted yield
- 1990Constructing a nominal index price from earnings and a fitted yield
- 1990Endpoint-pinned price paths are not forecasts
- 1990Constructing least-squares polynomial smoothers
- 1991Endpoint growth rates versus linear-regression consistency
- 1991Out-of-sample checks for linear growth fits
- 1991Trend as persistence, not a straight line
- 1991Quadratic trend, residual oscillator, and a secondary cycle calendar
- 1991Time-origin offset and residual-price divergence on a quadratic least-squares fit
- 1991A least-squares trendline from ordered prices
- 1992Constructing log-linear growth and reliability screens
- 1992Constructing log-linear growth-rate baselines
- 1992Next-session high, low, and close from rolling linear regression
- 1993Auditing an index price-earnings multiple with short-rate regression
- 1994Regression-seeded nested exponential price filter
- 1994Constructing the double exponential average from lag cancellation
- 1994Evaluating money supply as a linear leading-index baseline
- 1995Constructing least-squares trend channels
- 1995Linear baseline holdout checks for annual bill-rate forecasts
- 1995Projection bands from high and low regression slopes
- 1995Evaluating a least-squares end-point moving average on a known test series
- 1996Constructing an endpoint moving average from a least-squares line
- 1996Scoring equity path consistency with a k-ratio overlay
- 1996Evaluating month-end yield gaps for equity regimes
- 1996Constructing session-indexed standard error bands
- 1998Evaluating linear regression baselines for index valuation
- 1998R-squared as a two-state trend filter from a price-time fit
- 2000Second-order moving-average lag correction
- 2002Price regression line versus beta for index tracking
- 2003Regression slope with an r-squared trend confidence gate
- 2003Constructing finite-volume-element divergence with slope comparison
- 2004Building a daily score from regression, retracement, and volume
- 2004Constructing least-squares trendlines from ordered prices
- 2007Rectangle breakout targets beyond height
- 2007Confirming a price trend with regression slope and r-squared
- 2008A linear-regression angle assembled as one trend filter
- 2010A two-state swing machine from four running extremes
- 2016Score oil-complex tightness before divergence or regression
- 2017Nikkei-yen intermarket divergence as a regime case study
- 2017Constructing Calmar ratio and linear regression baselines
- 2019Pair-trade layer construction versus average-spread management
- 2020A convolution slope built from nested linear regression