1991issue C051-5
Endpoint growth rates versus linear-regression consistency
A multi-year earnings growth headline is a model output, not a raw fact. Rebuild the series, contrast the endpoint growth rate with a slope-based growth rate, and use the correlation of earnings with time as a consistency check.
- Six constructed earnings series can all open at 1.00 and close at 2.00 after five years and still follow different year-by-year paths. That is path dependence.
- An endpoint growth rate assigns the same figure to every series that shares those endpoints. Arithmetic average growth and geometric average growth cannot be computed when a year of zero earnings, or a zero or negative yearly change, appears in the path.
- A linear regression of earnings on calendar year still yields a slope-based growth rate when some earnings are zero or negative.
- The correlation coefficient from that regression measures how closely earnings track time and is the same quantity a published consistency figure restates as a percentage.
Treat the printed rate as a model output
A multi-year earnings growth headline is easy to read as a fact about the business. Editorial: treat that printed figure as a model output. Rebuild the yearly earnings series, contrast an endpoint growth rate with a slope-based growth rate from linear regression, and use the correlation of earnings with time as a consistency check before accepting the number.
Same endpoints, different paths
Six constructed earnings series can all open at 1.00 and close at 2.00 after five years while following visibly different year-by-year paths. That property is path dependence: two series with identical start and end values can still imply very different growth stories from the intervening observations.
Subtracting the first observation from the fifth and dividing by five intervals assigns the same growth rate to every series that shares those endpoints. Editorial: the endpoint growth rate is silent about the path, so it cannot distinguish those six series.
When average growth rates cannot be computed
An arithmetic average of successive percentage changes cannot be computed when a year of zero earnings puts a zero in a denominator. Arithmetic average growth is therefore undefined if any period starts at zero.
A geometric mean of yearly percentage changes is likewise unusable when any yearly change is zero or negative or any year's earnings equal zero. Geometric average growth cannot be computed in those cases.
A slope-based growth rate from linear regression
A linear regression of earnings on calendar year still yields a slope-based growth rate when some earnings are zero or negative. That slope-based growth rate is formed by dividing the regression slope of the series on time by the series average.
A worked linear-regression example on a steadily rising series produces a slope of 0.20, a slope-based five-year growth rate of 13.33 percent, and a correlation of 1.00.
Endpoint growth rate versus slope-based growth rate
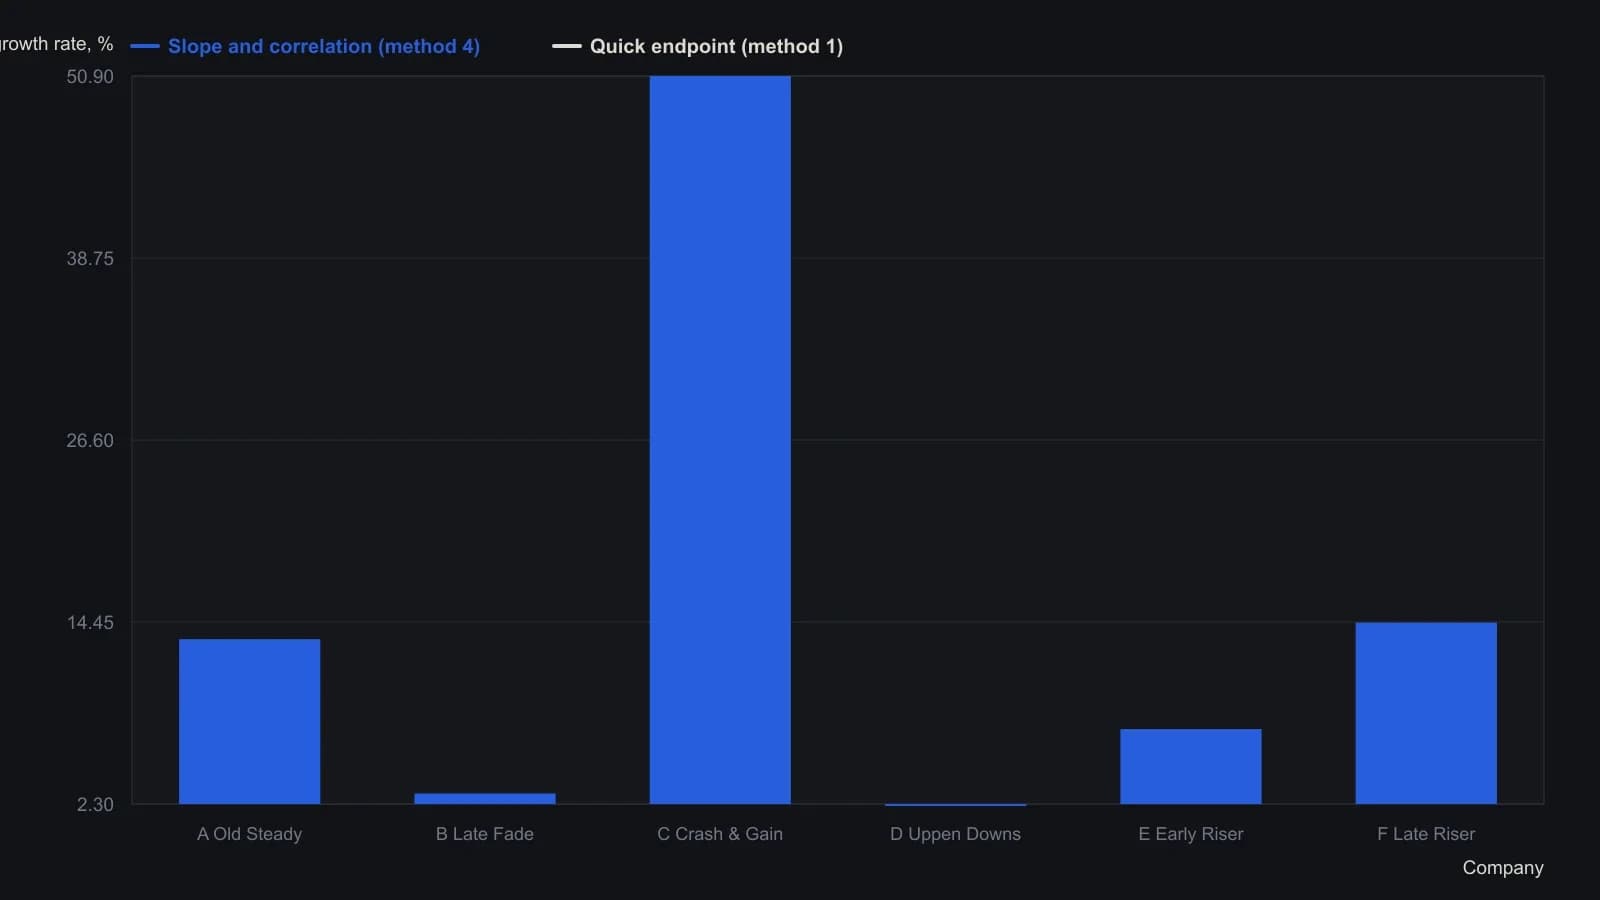
Method 1 is (ending minus beginning earnings) divided by five yearly intervals, which the source treats as a 20 percent rate for every name. Method 4 is the ordinary-least-squares slope of earnings on year, divided by mean earnings over 1980–1985. Companies are fictitious series constructed by the source.
Correlation as a consistency check
The correlation coefficient from that regression measures how closely earnings track time, with values nearer 1 indicating more regular growth along the fitted line.
For six consecutive years, that correlation equals the slope times 1.71 divided by the standard deviation of earnings, because 1.71 is the standard deviation of any six consecutive year labels.
A published earnings-growth consistency figure is the same correlation coefficient restated as a percentage rather than a decimal. Editorial: read that consistency percentage as a restated correlation, not as a separate test of the headline growth rate. If the rebuilt series does not track time closely, the printed growth rate is still only an endpoint or slope summary of that path.
All readings on this track · 43 readings
- 1990Constructing dollar baselines from rates, inflation, and residuals
- 1990Constructing a nominal index value from forward earnings and fitted yield
- 1990Constructing a nominal index price from earnings and a fitted yield
- 1990Endpoint-pinned price paths are not forecasts
- 1990Constructing least-squares polynomial smoothers
- 1991Endpoint growth rates versus linear-regression consistency
- 1991Out-of-sample checks for linear growth fits
- 1991Trend as persistence, not a straight line
- 1991Quadratic trend, residual oscillator, and a secondary cycle calendar
- 1991Time-origin offset and residual-price divergence on a quadratic least-squares fit
- 1991A least-squares trendline from ordered prices
- 1992Constructing log-linear growth and reliability screens
- 1992Constructing log-linear growth-rate baselines
- 1992Next-session high, low, and close from rolling linear regression
- 1993Auditing an index price-earnings multiple with short-rate regression
- 1994Regression-seeded nested exponential price filter
- 1994Constructing the double exponential average from lag cancellation
- 1994Evaluating money supply as a linear leading-index baseline
- 1995Constructing least-squares trend channels
- 1995Linear baseline holdout checks for annual bill-rate forecasts
- 1995Projection bands from high and low regression slopes
- 1995Evaluating a least-squares end-point moving average on a known test series
- 1996Constructing an endpoint moving average from a least-squares line
- 1996Scoring equity path consistency with a k-ratio overlay
- 1996Evaluating month-end yield gaps for equity regimes
- 1996Constructing session-indexed standard error bands
- 1998Evaluating linear regression baselines for index valuation
- 1998R-squared as a two-state trend filter from a price-time fit
- 2000Second-order moving-average lag correction
- 2002Price regression line versus beta for index tracking
- 2003Regression slope with an r-squared trend confidence gate
- 2003Constructing finite-volume-element divergence with slope comparison
- 2004Building a daily score from regression, retracement, and volume
- 2004Constructing least-squares trendlines from ordered prices
- 2007Rectangle breakout targets beyond height
- 2007Confirming a price trend with regression slope and r-squared
- 2008A linear-regression angle assembled as one trend filter
- 2010A two-state swing machine from four running extremes
- 2016Score oil-complex tightness before divergence or regression
- 2017Nikkei-yen intermarket divergence as a regime case study
- 2017Constructing Calmar ratio and linear regression baselines
- 2019Pair-trade layer construction versus average-spread management
- 2020A convolution slope built from nested linear regression