2017issue C078-15
Nikkei-yen intermarket divergence as a regime case study
This 2017 case study uses the Nikkei 225 and USD/JPY to show how Intermarket analysis can frame an equity-currency pairing as a market regime. Editorial view: treat Linear regression and Price-indicator divergence as a second step, and test that trigger only while the pairing is still intact.
- A weaker home-currency exchange rate can make export goods cheaper and more competitive abroad, which is the economic premise used to link Japanese equities with the yen.
- USD/JPY is the correlation pair because the United States accounted for 20.2% of Japanese exports in 2015, and carry-trade flows can reinforce the same equity-currency link.
- The pairing is not constant: yearly correlations were weaker or negative in the 1990s, later strengthened under ultra-loose Bank of Japan policy, and can give way to the S&P 500 when panic dominates.
- Editorial view: a 50-day Linear regression Price-indicator divergence reading is a trigger to test only after checking that the Nikkei-yen regime is still intact.
Why the archive paired the Nikkei with the yen
A weaker home-currency exchange rate can make export goods cheaper and more competitive abroad. That is the economic premise used to link Japanese equities with the yen.
After the June 2016 Brexit vote through early 2017, the British pound fell 18.7% against the US dollar while the FTSE 100 rose 17.2%. The archive presented that move as a contemporaneous equity-currency example of the same export-competitiveness idea.
In 2015 the United States was Japan’s most important export partner, accounting for 20.2% of Japanese exports. That is why USD/JPY is used as the correlation pair for the Nikkei 225.
Carry trade as a second link
The yen-equity link is also reinforced by carry-trade mechanics. Optimism tends to fund equity exposure by selling a lower-yielding yen for dollars, while risk aversion forces those trades to be reversed.
What the Nikkei 225 is
The Nikkei 225 is a modified price-weighted index of 225 first-section Tokyo common stocks. In February 2017 Fast Retailing had a 6.95% weight, larger than the 6.55% combined weight of Japanese ADSs trading in New York.
The pairing is a regime, not a constant
A weekly overlay from 2006 to February 2017 shows the Nikkei tracking USD/JPY closely. The archive also notes that the equity-currency relationship can change with interest rates, monetary policy, quantitative easing, earnings, and global conditions.
Yearly correlations were weaker or negative in the 1990s and later strengthened as the yen became a funding currency under ultra-loose Bank of Japan policy. From 2002 through early 2017 the Nikkei-USD/JPY correlation turned negative only in 2003 and 2009, late in those bear markets.
The regression divergence trigger
On a DXJ chart from December 2015 to January 2017, the 50-day regression divergence indicator generated buys when it crossed above 75 and then turned down within three days. It generated shorts when it crossed below 25 and then turned up.
Most backtest profits for the intermarket divergence system clustered in 2011-2015, coinciding with the stronger Nikkei-yen correlation window.
Editorial reading: filter first, trigger second
Editorial view: Intermarket analysis of the Nikkei and USD/JPY is the first question, because the archive itself shows that the pairing can fade with policy, earnings, global conditions, and fear. Linear regression and Price-indicator divergence are the second question: a defined 50-day reading with 75 and 25 crossings.
Editorial view: the backtest clustering inside the stronger correlation window is a reason to ask whether that divergence reading is only useful while the regime is still intact, not a reason to treat the trigger as standalone.
DXJ 50-day regression divergence versus 75/25 signal lines
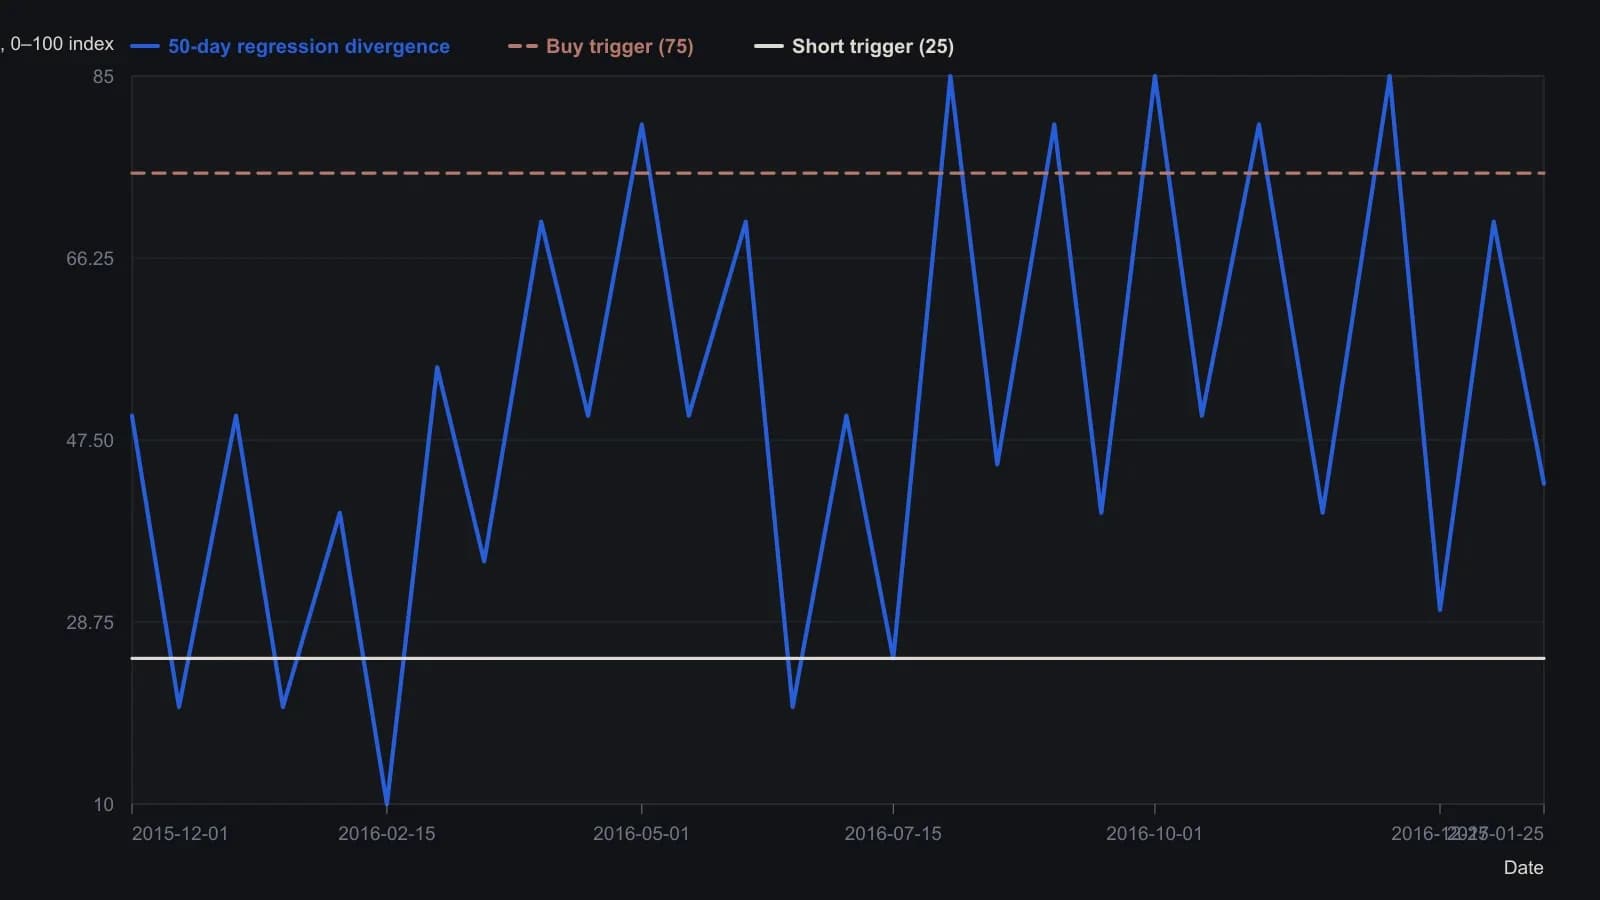
Katsanos fixes a 50-day regression window. The published rule buys a close after a 75-break that turns down within three days, and shorts a 25-break that turns up. This pane is the choppy 2016 tail of a 2007–2017 test; most backtest profit accrued in 2011–2015, when Nikkei–yen correlation was strong.
All readings on this track · 43 readings
- 1990Constructing dollar baselines from rates, inflation, and residuals
- 1990Constructing a nominal index value from forward earnings and fitted yield
- 1990Constructing a nominal index price from earnings and a fitted yield
- 1990Endpoint-pinned price paths are not forecasts
- 1990Constructing least-squares polynomial smoothers
- 1991Endpoint growth rates versus linear-regression consistency
- 1991Out-of-sample checks for linear growth fits
- 1991Trend as persistence, not a straight line
- 1991Quadratic trend, residual oscillator, and a secondary cycle calendar
- 1991Time-origin offset and residual-price divergence on a quadratic least-squares fit
- 1991A least-squares trendline from ordered prices
- 1992Constructing log-linear growth and reliability screens
- 1992Constructing log-linear growth-rate baselines
- 1992Next-session high, low, and close from rolling linear regression
- 1993Auditing an index price-earnings multiple with short-rate regression
- 1994Regression-seeded nested exponential price filter
- 1994Constructing the double exponential average from lag cancellation
- 1994Evaluating money supply as a linear leading-index baseline
- 1995Constructing least-squares trend channels
- 1995Linear baseline holdout checks for annual bill-rate forecasts
- 1995Projection bands from high and low regression slopes
- 1995Evaluating a least-squares end-point moving average on a known test series
- 1996Constructing an endpoint moving average from a least-squares line
- 1996Scoring equity path consistency with a k-ratio overlay
- 1996Evaluating month-end yield gaps for equity regimes
- 1996Constructing session-indexed standard error bands
- 1998Evaluating linear regression baselines for index valuation
- 1998R-squared as a two-state trend filter from a price-time fit
- 2000Second-order moving-average lag correction
- 2002Price regression line versus beta for index tracking
- 2003Regression slope with an r-squared trend confidence gate
- 2003Constructing finite-volume-element divergence with slope comparison
- 2004Building a daily score from regression, retracement, and volume
- 2004Constructing least-squares trendlines from ordered prices
- 2007Rectangle breakout targets beyond height
- 2007Confirming a price trend with regression slope and r-squared
- 2008A linear-regression angle assembled as one trend filter
- 2010A two-state swing machine from four running extremes
- 2016Score oil-complex tightness before divergence or regression
- 2017Nikkei-yen intermarket divergence as a regime case study
- 2017Constructing Calmar ratio and linear regression baselines
- 2019Pair-trade layer construction versus average-spread management
- 2020A convolution slope built from nested linear regression