2000issue C081-5
Constructing rectangles for breakout hypotheses
Price usually pauses in a bounded range before a trend is abandoned. Construct that range as a rectangle, choose the scale that sets the measuring-objective, read the volume-taper, and state a hold-or-fail test so a later breakout can be marked proven or unproven.
- A rectangle is two roughly parallel horizontals around a bounded range. It can finish as a reversal-formation or a continuation-formation, and the prints inside the box do not show breakout direction.
- Pattern-significance follows from how long the range takes to form and how deep it is. A brief box is easy to miss on a slower chart and is treated as leading a brief next move.
- The measuring-objective copies the vertical depth of the box from the breakout point. Arithmetic-scale and logarithmic-scale projections diverge on longer-term charts and should be chosen before that objective is written down.
- A breakout still has to hold. An advance without a rise in activity is suspect, a failed hold is unproven, and a later retracement can supply a second confirmation.
A bounded range, then two horizontals
Price usually spends time in a bounded range before a trend is abandoned. That range can be constructed as a rectangle: two roughly parallel horizontals that contain the contest between buyers and sellers until price leaves the box.
Pattern-significance from time and depth
How long a rectangle takes to form, and how deep it is, governs pattern-significance: how much weight the next move is given. A range that lasts hours can be invisible on a daily chart and is typically followed by a move of similar brevity. A range that takes about a year to form is associated with a longer, stronger follow-through.
Prints inside the box do not pick a side
A rectangle can resolve as either a reversal-formation or a continuation-formation. The prints inside the box do not by themselves reveal breakout direction, so the prior trend is assumed still in force until the chart shows otherwise. Until the chart proves a reversal, the pause is treated as a continuation-formation.
Measuring-objective and the price scale
The measuring-objective is the vertical distance between the top and bottom of the pattern, projected from the breakout point in the direction of the break.
On longer-term charts the vertical scale changes that objective. An arithmetic-scale projection of a range between 4 and 10 can land below zero, because equal vertical distances represent equal currency amounts. A logarithmic-scale projection of the same range stays a proportionate swing, because equal vertical distances represent equal percentage changes. The two scales differ little on very short-term charts.
Volume-taper before the break
Volume typically trends from relatively high on the left of the formation toward relatively low on the right as the contest evens out. That volume-taper is the usual background. An upside breakout without a rise in activity is treated as suspect. A downside breakout can occur on light or heavy volume, because prices can fall when bids disappear.
A breakout still has to hold
A breakout is a move through the upper or lower boundary that still has to prove it can hold, and on advances is expected to show expanding activity. A historic rule that treated a 3 percent penetration as a valid breakout is presented as no longer reliable on fast intraday charts. Some traders instead require two consecutive closes, or two bars of the chart’s own interval, beyond the boundary. A move that fails to hold outside the pattern is treated as unproven.
Whips, exits, and retracement
After a whippy breakout, one construction places an exit beyond the prior minor swing and another exits if price recrosses the halfway mark of the pattern’s depth. After a breakout, a retracement is common. A small trendline across the pullback peaks can supply a second confirmation when that line is broken.
Allstate year-long rectangle and the 1995 upside break
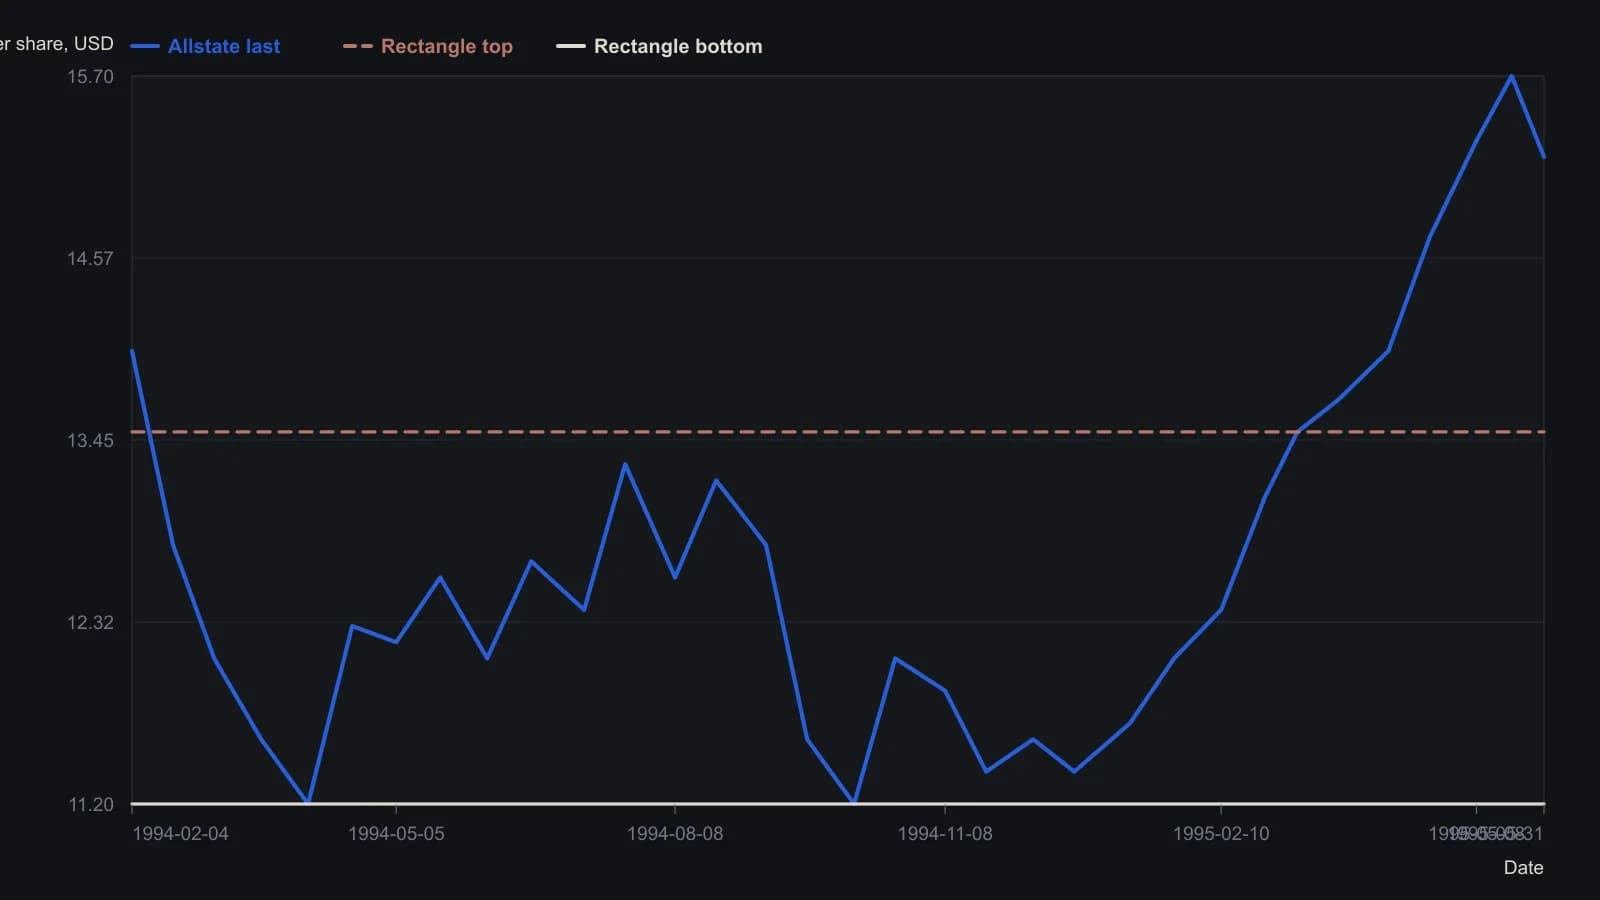
Digitized from the printed daily pane, so prices are only good to about a tenth of a dollar. The source already lets the tape nick through the box; those pierces were kept. Volume sits in a separate pane on the same figure and is not mixed onto this price scale.
All readings on this track · 25 readings
- 1986Construct a decision procedure that revises itself
- 1989Finish the volume checklist before scoring the breakout
- 1989Constructing supervised forecasts on moving averages
- 1991Candlestick labels as stacked construction tests
- 1992Walk-forward evaluation of weekly price-change patterns
- 1993RSI price pattern templates and open interest
- 1994Constructing a dual-net day-ahead index direction forecast
- 1994A clocked stochastic second crest with a window-high stop
- 1996Volatility-ratio, inside-day and narrow-range-4 entry construction
- 1998Sliding-window correlation for cup-and-handle construction
- 2000Constructing rectangles for breakout hypotheses
- 2001Turning one candle into a ranked numeric object
- 2002Fuzzy-scored chart patterns as testable rules
- 2002From hot-zones to an open-close-matrix
- 2003Volume pressure and a band-clearing breakout case
- 2004Evaluating chart patterns against price objectives
- 2004Cobweb turning points from price structure
- 2005Hybrid decision trees and pattern recognition for trend rules
- 2005Two-bar zone codes for testable pattern systems
- 2005Price bar pattern construction and next-bar frequency
- 2008Observe markets before following pattern or system rules
- 2012Treat a four-leg Fibonacci completion as an unpaid hypothesis
- 2014Hidden three-channel regression signals for stock and call option entries
- 2014A shared daily-chart-level framework for session trades and swing holds
- 2015Condensed candlestick signatures