1996issue C101-3
Dual-horizon ratio envelopes and regression error channels
A gold-mining index divided by a gold-bullion price is wrapped in long-horizon and short-horizon moving-average envelopes, then switched with four crossing tests. A second band is the smoothed fitted line plus and minus twice the smoothed residual-standard-error, with the close mapped as a percent-channel-location.
- The ratio-series is a gold-mining index divided by a gold-bullion price, and it is formed before any envelope is drawn.
- The long-horizon-envelope and the short-horizon-envelope use different lookbacks and standard-deviation offsets, and the mechanical-switch is four named crossings executed at the bar close.
- The residual channel is the smoothed fitted value plus and minus twice the smoothed residual-standard-error, with the close also mapped as a percent-channel-location.
- Editorial reading: an average-plus-dispersion band measures distance from a moving mean, while a fit-plus-error band measures distance from a local line.
A ratio before any envelope
The archive begins with a ratio-series. That series is the quotient of a gold-mining index and a gold-bullion price. The two envelopes and the later residual channel are written only after that quotient exists.
Editorial note: this article follows those writing steps as a construction lesson. It is not a view on metals and it does not rank one envelope style over the other.
Long and short deviation horizons
The long-horizon-envelope equals the 46-period average of the ratio-series plus or minus 2.3 times its 46-period standard deviation. That gives a long top edge and a long bottom edge.
The short-horizon-envelope equals the 4-period average of the same ratio-series plus or minus 1.6 times its 4-period standard deviation. That gives a short top edge and a short bottom edge. Both horizons are moving-average channels around one series. They differ in lookback and in how many standard deviations offset the edges.
K-ratio with 46-week standard-deviation envelopes
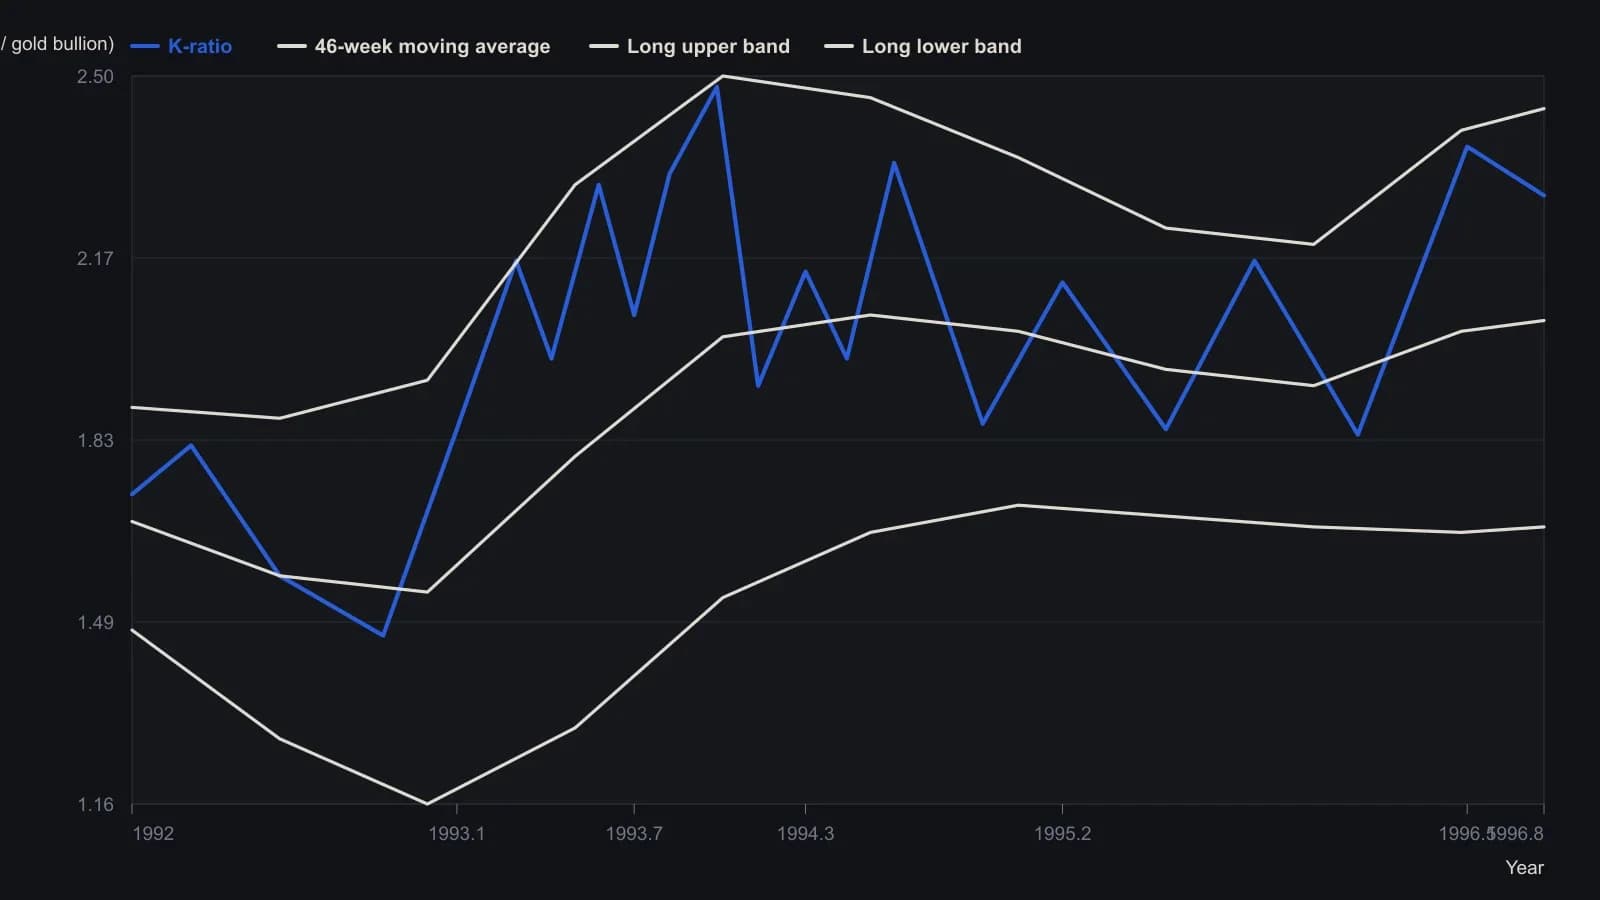
Digitized from the printed weekly chart; y is good to about ±0.03. Long bands use the source’s 46-week window and 2.3σ offset. The figure also draws a 4-week, 1.6σ envelope that sits too close to the ratio to recover as its own series.
Four crossings as one switch
A buy signal is true when the ratio-series crosses upward through the long lower envelope or downward through the short upper envelope. A sell signal is true when the ratio-series crosses downward through the long upper envelope or upward through the short lower envelope.
Those four tests are the mechanical-switch. The mechanical procedure opens one long unit and later closes that long unit at the close of the bar that prints the matching signal.
A channel from fit and residual error
A second envelope is built from a fitted line rather than from a moving average. Residual-channel construction estimates the regression-slope of close versus bar index from a covariance-style summation divided by the variance of the bar index. The regression-intercept is then recovered from the mean close minus that slope times the mean bar index.
After the lookback is satisfied, residual-standard-error uses a divisor of length minus 2. The fitted value and the error width are then each smoothed. Published defaults are 21 for length and 3 for the smoother. The displayed residual channel is the smoothed fitted value plus and minus twice the smoothed standard error.
A companion reading, the percent-channel-location, maps the close onto that channel as one hundred times the distance from the lower band divided by the full band width.
All readings on this track · 45 readings
- 1992Constructing volatility-scaled bands with relative strength index confirmation
- 1994Implied volatility as a band-defined regime filter for index options
- 1995Constructing projection bands from least-squares slopes
- 1995Constructing regression projection bands and range oscillators
- 1996Constructing Bollinger bands, percent-b, and stochastics
- 1996Constructing mechanical rules from Bollinger Bands and stochastics
- 1996Constructing a standard-error envelope around a linear regression
- 1996Dual-horizon ratio envelopes and regression error channels
- 1997Rational group structure with a trend screen, RSI, and bands
- 1997Asymmetric volatility band construction
- 1998Constructing three-state filters from Bollinger band envelopes
- 1999Combination filters with Bollinger Bands and the relative strength index
- 1999Constructing stochastic timed exits and band-RSI reversals
- 1999Evaluating Bollinger Bands against fixed-width and range-based envelopes
- 2000Constructing a Bollinger Band target as a forward price
- 2001Numeric candlestick encoding with local size bands
- 2001Ranked candlestick sentiment to band-cross entries
- 2002Combining Bollinger Bands, RSI, and a stop-loss
- 2002Bollinger Bands remain filters, not forecasts
- 2002Constructing a stochastic RSI with Bollinger bands
- 2002Constructing a StochRSI and Bollinger mechanical system
- 2003Constructing volatility-scaled Bollinger envelopes
- 2003Why tick breadth fails as a market personality
- 2005Constructing Bollinger bands versus fixed trading bands
- 2006Squared versus absolute deviation in envelope construction
- 2006Confirming yen crossovers with implied volatility and bands
- 2006A daily candle reversal is a hypothesis until shorter sessions fail at the same zone
- 2008Rebuild the Relative Strength Index as price-scale bands
- 2008Reading Relative Strength Index extremes on one price axis with Bollinger Bands and moving averages
- 2011Three-filter confirmation for short-swing futures
- 2011Constructing an inverse Fisher stochastic with bands and averages
- 2012Constructing a Bollinger Band indicator suite
- 2012Stacking price extremes, crossovers, bands, and MACD
- 2012Adaptive Bollinger band impulse, trend, and momentum filters
- 2013Rescaling stochastic, percent-B, and wave-count parameters
- 2014Industry-group quartile pivots as a Bollinger Bands case study
- 2014Bollinger Bands as adaptive price envelopes: a 2014 classroom case
- 2016Trend-channel entry rules from stacked moving averages
- 2016A permission stack for Bollinger, RSI, and the 50-period average
- 2017Constructing weighted Bollinger bands and volume averages
- 2017Four swing-entry rules that share a timed exit
- 2017Two-wave monthly cycles as a regime filter
- 2019Constructing exponential-deviation-bands from a midline-average
- 2020Critiquing exponential variants of Bollinger Bands
- 2020Constructing selectable volatility and moving-average bands