2006issue C061-7
Linear forecast versus buy-and-hold when price changes cluster
Treat a one-day linear forecast as an explicit baseline. Judge the mechanical trading system by how often a sign-and-size filter places a wager, and how often it sits out.
- Use linear regression only as a one-day-ahead baseline change forecast from a short run of recent closes.
- Convert that forecast, a local volatility scale, and a wager cutoff into a mechanical trading system that may go long, go short, or take no trade.
- General Electric, Zimmer Holdings, and Whole Foods Market produced zero wagers, even though Whole Foods Market still showed a relatively large buy-and-hold result because its price-change signs flipped too often.
- Most names that beat buy-and-hold did so when price moved in the same direction for four consecutive days and the last change was large enough to realize a profit under the rule.
A baseline that assumes independent increments
The Brownian price-change model used as the baseline assumes independent, normally distributed increments whose mean and standard deviation do not change through time.
A 253-day General Motors close-to-close series, after subtracting mean -0.039 and dividing by standard deviation 0.727, produced a largest move above seven standard deviations, while matched computer white noise rarely exceeded two. That construction is a normalized price change: a daily close-to-close change after subtracting its sample mean and dividing by its sample standard deviation.
How the forecast becomes a wager
Linear regression, as used here, is a one-day-ahead price estimate built from a short run of recent closes and used only as a baseline change forecast. The evaluated system estimates the next close from the prior three prices, scales that estimated change by the standard deviation of the last seven changes, and treats the ratio as a standardized one-day forecast.
A three-price forecast lag was chosen because it is the shortest window that can register a trend and still leave more candidate wagers than a longer lag.
A mechanical trading system is a fully specified wager rule that converts the forecast, a local volatility scale, and a cutoff into long, short, or no trade. The wager cutoff is the minimum absolute standardized forecast required before the system is allowed to take a position. The fortune indicator is a running sum of signed fractional price changes that records what the rule would have earned if each wager had been placed the day before.
When clustered moves matter, and when the rule sits out
Across the screened names, General Electric, Zimmer Holdings, and Whole Foods Market produced zero wagers: no cutoff yielded a nonnegative fortune-indicator increment.
Whole Foods Market still showed a relatively large buy-and-hold result, but its price-change signs flipped too often for the linear predictor to place a trade.
Most names that beat buy-and-hold did so when price moved in the same direction for four consecutive days and the last change was large enough to realize a profit under the rule.
A replacement estimator and an untested cutoff
The write-up treats a Kalman filter as a possible replacement estimator if the linear baseline cannot capture curvature. In that role the Kalman filter is a suggested next estimator for trend curvature when a short linear fit is too rigid. The same write-up flags letting the cutoff fall below one as an untested extension.
Linear-forecast last-day fortune versus buy-and-hold
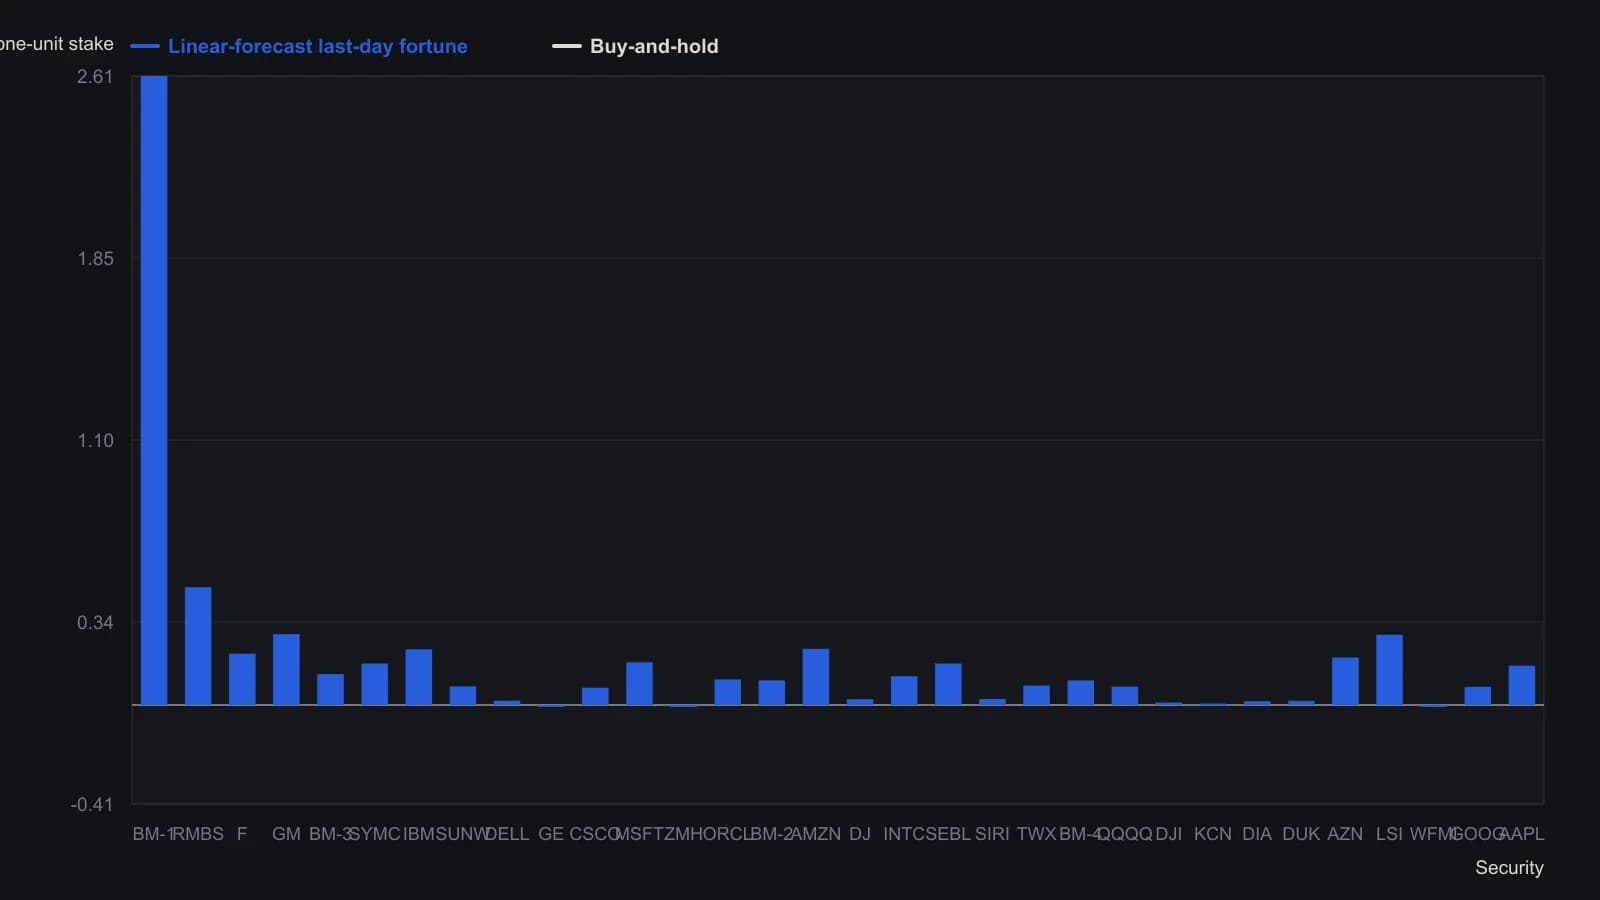
Cutoff C was chosen in-sample by testing 1.00 to 4.00 in steps of 0.01 to maximize last-day fortune. Commissions were ignored. Forecast used the prior three closes; sigma used the prior seven daily changes.
All readings on this track · 5 readings
- 1998T3 adaptive smoothing from regression benchmarks
- 1999Lagged trend filters for neural-network inputs
- 2006Linear forecast versus buy-and-hold when price changes cluster
- 2010Treat a market as a transfer device before completing a price path
- 2018Constructing predictive filters with RSI and walk-forward tests