1992issue C081-3
A pre-trade checklist for trendline breaks and loss limits
This archive case study reconstructs a historical rule set as one written go, wait, or pass sequence. An editorial reading treats market-state clarity, a falsifiable trendline, and a structure-based stop-loss as a single pre-trade procedure rather than a pile of chart tips.
- Read the archive rules as one checklist-process: a written go, wait, or pass sequence that emits a single decision for the system's holding period.
- When the market state is not clearly defined, the procedure uses a light-commitment and skips uncertain two-way action instead of taking full exposure.
- A trendline touch, hug, or break is useful only as a hypothesis that can fail, with volume-on-approach allowed to block the signal.
- Place the stop-loss on the price structure before any order is sent. Limiting a loss and letting an open gain continue stand even when they conflict with other rules.
Read the rules as one procedure
The rule set was first assembled in 1934 after losses in 1929 and was reviewed again in 1974. At that later review, general items 1 through 5 and technical items 1, 4, 5, and 9 were marked as still the most important.
Editorial reading: those surviving items are treated as a checklist-process, a written go, wait, or pass sequence that consumes rule inputs, market state, and execution constraints and emits a single trade decision for the system's holding period.
Decide whether the setup is clear enough to act
When the market state is not clearly defined, the procedure calls for a light-commitment and for concentrating on well-defined moves so uncertain two-way action is more often skipped. A light-commitment is a reduced size used so unclear conditions do not receive full exposure.
The checklist tells the operator not to act at once on widely shared opinion and not to take a position in the direction of an immediately preceding three-day burst until a one-day-reversal appears. A one-day-reversal is a single session that prints against that short burst and is used as a wait-or-add filter.
November 1991 soybeans: sideways ranges then measured continuation
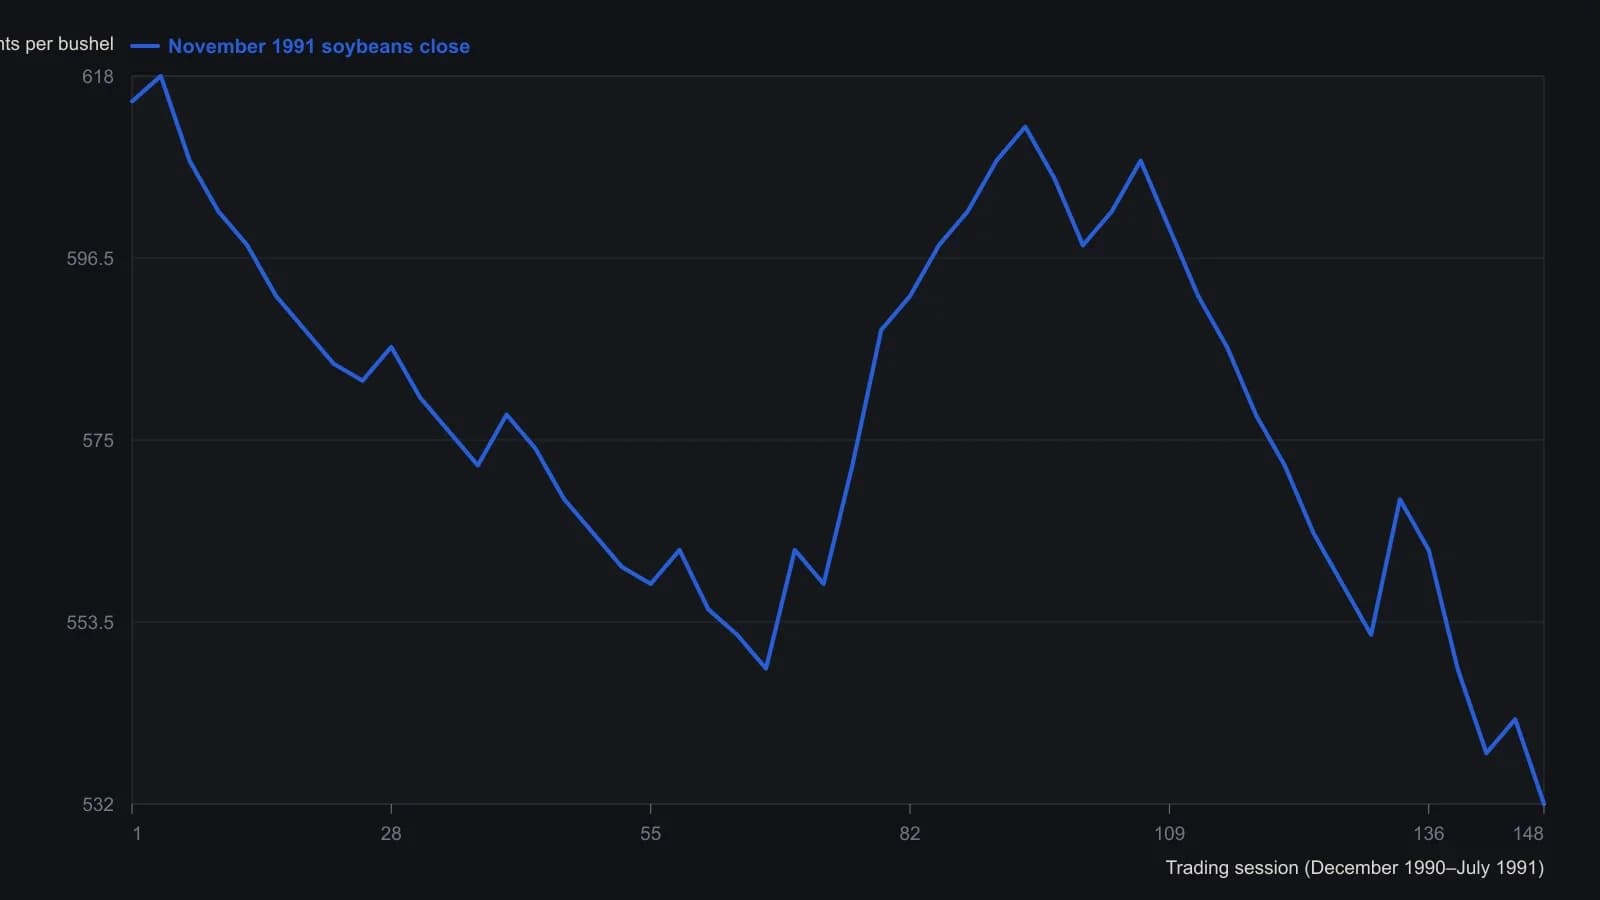
Daily high-low-close bars digitized from the printed November 1991 soybeans figure. Closings are approximate to about 2 cents; the raster does not support finer ticks. Horizontal marks on the source are the sideways ranges in Technical Guide 1, not extra plotted series.
State a trendline condition that can fail
A trendline is a line through open-high-low-close structure on a chosen chart scale, used so a touch, repeated contact, or break can be stated as a falsifiable hypothesis.
A trendline approached on moderate or dull volume is treated as a watch point, provided the line has not already been touched so often that the condition is worn out. That accompanying activity is volume-on-approach, an input that can allow or block the signal.
Repeated contact that hugs a minor or major trendline is presented as a setup in which that line is likely to break.
A break of a minor-counter-trendline, a short-span line drawn along a pullback that runs against the larger trend, is treated as a place to take or reverse a position, including by using stops at that break.
After a directional move, a sideways-range is a lateral pause the procedure treats as a possible hinge. The technical list then expects a second leg of similar extent in the same direction and then often a countermove back toward that pause.
During an ongoing move, the procedure allows initiating or adding in the move's direction on the following morning after any one-day-reversal, especially if volume declines on that reversal session.
Attach a stop so the loss is already bounded
A stop-loss is a pre-placed exposure bound that uses stop distance and account constraints to keep the loss decision fixed before entry and while the position is open.
Stop orders are described as a way to cap a loss, protect an open gain, and enter from certain chart formations. They are treated as more useful when the stop is placed in relation to the price structure rather than in isolation.
The general list treats limiting a loss and allowing an open gain to continue as a constraint that stands even when it conflicts with the other rules.
All readings on this track · 53 readings
- 1984Constructing the slow stochastic from a five-session range
- 1985Gold-proxy trendlines and a January support base
- 1988Construct a five-week new-highs total as a breadth chart
- 1988Stacked channel, trendline, and moving-average warnings in 1987
- 1989Auditing fifth-wave counts with equality, Fibonacci, and trendlines
- 1990Money-fund maturity as a companion Eurodollar chart
- 1990Constructing wave targets from ratios, triangles and trendlines
- 1992Nested time frames for trend and channel signals
- 1992A pre-trade checklist for trendline breaks and loss limits
- 1992Bond-fund timing inside trendlines, retracements, and dual averages
- 1992Two-point trendline construction from rise over run
- 1993Disposable chart ratings from confirmed level tests
- 1993When trend channels define fair value after dislocations
- 1993Valid trendline anchors for three-part reversals
- 1994Pairing stochastic divergence with trendline invalidation
- 1995Constructing measured targets after trendline breaks
- 1997A three-part pullback plan with RSI, Fibonacci retracements, and a tight trendline
- 1998Rule-based Trendline construction for testable entries
- 2000Constructing trendlines, breaks, and role reversal
- 2000Constructing speed resistance lines from trend extremes
- 2000Nasdaq tech cycle stages with a 15-day average and trendlines
- 2002Two-session candlesticks that test support, resistance, and trendlines
- 2002Constructing Fibonacci ratio grids from a peak and a trough
- 2002Evaluate trendline geometry before trusting a breakout
- 2002Trendline, volume, and breakout hypotheses versus cycle-end stories
- 2003Writing the long S&P 500 trendline and cycle junction as one hypothesis
- 2003A three-event trendline reversal checklist
- 2003Reverse-engineered Relative Strength Index price curves
- 2003Two-anchor trendline construction without cut-through
- 2004Treat a 15-minute e-mini stair-step as congestion under a daily lid
- 2005A 50-day average, a trendline break, and an open barrier flip
- 2005Matching a forty-day average to a crude trendline
- 2006Constructing a relative spread-strength oscillator for staged cycle confirmation
- 2006Constructing a log-change probability line for trend and range rules
- 2007Linked cross breaks as dollar-pair filters
- 2007A case study in support, resistance, and trendline role reversal on currency charts
- 2007Reading trendline breaks in a housing-sector case
- 2007Constructing replaceable trendlines for break signals
- 2007Reading trendline breaks before the mechanical signal
- 2007Trading choppy forex trends with channels and Fibonacci breaks
- 2007A stacked hypothesis from wave, trendline, ratio, and candle
- 2008Exit rules before entry: trendline, support, and stops
- 2008Capitulation headlines need trend confirmation
- 2008RSI divergence classes, ratio thresholds, and trendline tests
- 2010Support and resistance as falsifiable chart hypotheses
- 2012Reading a 2012 software directory as a breakout and channel case study
- 2013Treat a currency position as a regime, then map shared levels
- 2014Evaluating trendline swing size per market
- 2018Intermarket regime stress and the January 2018 trendline break
- 2018Weekly and daily Stochastic oscillator construction on a single daily chart
- 2018Constructing trendlines, support, and breakout targets from crowd exits
- 2019Trendline break and Fibonacci retracement as a falsifiable outlook check
- 2019Monthly S&P 500 false-break versus the decade trendline