2013issue C0944-48
Treat a currency position as a regime, then map shared levels
A single currency position is judged first by how rates, equities, metals, and related pairs already constrain it. The archive workflow then uses only shared trendline and moving-average levels across time frames as the entry and invalidation map.
- Interest-rate differentials, inflation, and central-bank balance-sheet data start the currency watch, but chart structure still matters because a capital-flow-regime can dominate bilateral fundamentals.
- Gold, the Australian dollar, the South African rand, the yen and the Nikkei, US rates, and euro sentiment are described as transmitting into one another, so intermarket-analysis belongs even in a one-market book.
- Support or resistance that appears on two or more of the four-hour, daily, three-day, and weekly charts is treated as a more robust time-frame-cluster than a level on only one horizon.
- Trendline and moving-average structure are the default tools, with risk kept to small size and optional downside protection on holdings that may last up to 12 months.
Start with the regime, not the pair
A currency position is not judged from its own chart alone. Portfolio-and-market-context asks how other markets and portfolio exposures already price the same risk.
Interest-rate differentials, inflation, and central-bank balance-sheet data are presented as the primary macroeconomic inputs for watching currency markets. Chart structure is still treated as necessary, because capital flow and sentiment can dominate bilateral fundamentals.
When exchange rates follow those cross-border money movements more than a bilateral trade or inflation snapshot, the market is in a capital-flow-regime.
A weaker currency is not an export plan
A weaker home currency is not treated as a reliable export-growth mechanism. Yen strength coexisted with rising Japanese exports in the 1970s and 1980s, while a multi-decade rupee decline did not produce a comparable Indian export expansion.
What other markets already transmit
Even a single-market trader is told to watch other asset classes. Gold, the Australian dollar, and the South African rand, yen and the Nikkei, US rates, and euro sentiment are described as transmitting into one another.
Commodity prices are described as increasingly sensitive to currency moves because large funds treat commodities as an asset class and embed exchange-rate views in those allocations.
That reading is intermarket-analysis: how interest-rate differentials, equity indexes, metals, and related currency pairs move together so one trade sits inside a broader market regime rather than a single-chart story.
How long a currency trend is allowed to last
Major-currency trends are characterized as shorter-lived in the five years before mid-2013 than in the 1990s and early 2000s, with the 2013 dollar-yen rise cited as an exception. The change is attributed to faster information and post-2008 policy coordination.
Emerging and less-traded currencies are described as able to sustain larger, longer trends because information, volume, and participation are thinner than in the majors.
Shared levels as the only map
Intermarket chart work is presented as a substitute for standalone fundamental analysis, including experiments such as dividing an equity index by its local currency pair.
The preferred technical toolkit is limited to trendlines and moving averages as the default tools, with Fibonacci used sometimes, momentum only in special cases, and oscillators generally de-emphasized.
A trendline is a hand-drawn support or resistance line on price structure used to state a directional hypothesis that later price action can confirm or break. A moving-average is a lookback average of sequential prices used as a quantitative baseline for trend direction and as a common level that can cluster with trendlines across time frames.
A multi-horizon overlay is used to find support or resistance that is common to two or more of the four-hour, daily, three-day, and weekly charts. Those shared clusters are treated as more robust than single-horizon levels. The coincidence is a time-frame-cluster.
BSE Sensex priced in dollars, 2003–2013
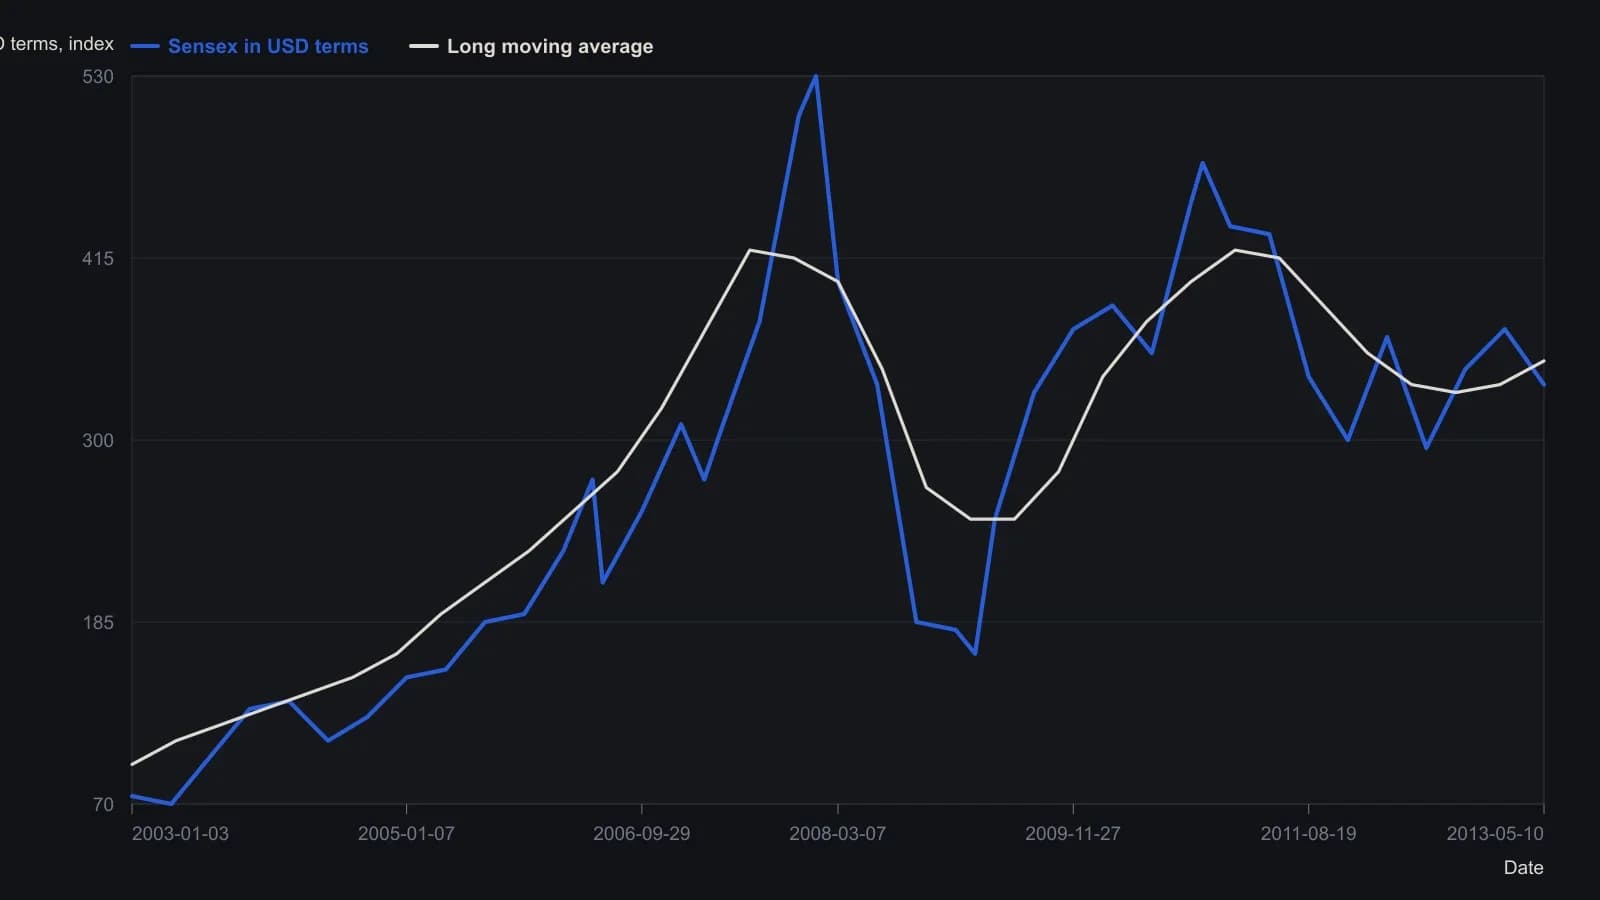
Y-values are approximate readings from the raster, rounded to the nearest five index points. The gray overlay is a long moving average; the interview never states the lookback. Hand-drawn trendlines on the original are not replotted as separate series.
Size and optional protection
Risk control is described as small position size plus optional downside protection on holdings that may last up to 12 months, illustrated by pairing a long equity exposure with a put.
All readings on this track · 53 readings
- 1984Constructing the slow stochastic from a five-session range
- 1985Gold-proxy trendlines and a January support base
- 1988Construct a five-week new-highs total as a breadth chart
- 1988Stacked channel, trendline, and moving-average warnings in 1987
- 1989Auditing fifth-wave counts with equality, Fibonacci, and trendlines
- 1990Money-fund maturity as a companion Eurodollar chart
- 1990Constructing wave targets from ratios, triangles and trendlines
- 1992Nested time frames for trend and channel signals
- 1992A pre-trade checklist for trendline breaks and loss limits
- 1992Bond-fund timing inside trendlines, retracements, and dual averages
- 1992Two-point trendline construction from rise over run
- 1993Disposable chart ratings from confirmed level tests
- 1993When trend channels define fair value after dislocations
- 1993Valid trendline anchors for three-part reversals
- 1994Pairing stochastic divergence with trendline invalidation
- 1995Constructing measured targets after trendline breaks
- 1997A three-part pullback plan with RSI, Fibonacci retracements, and a tight trendline
- 1998Rule-based Trendline construction for testable entries
- 2000Constructing trendlines, breaks, and role reversal
- 2000Constructing speed resistance lines from trend extremes
- 2000Nasdaq tech cycle stages with a 15-day average and trendlines
- 2002Two-session candlesticks that test support, resistance, and trendlines
- 2002Constructing Fibonacci ratio grids from a peak and a trough
- 2002Evaluate trendline geometry before trusting a breakout
- 2002Trendline, volume, and breakout hypotheses versus cycle-end stories
- 2003Writing the long S&P 500 trendline and cycle junction as one hypothesis
- 2003A three-event trendline reversal checklist
- 2003Reverse-engineered Relative Strength Index price curves
- 2003Two-anchor trendline construction without cut-through
- 2004Treat a 15-minute e-mini stair-step as congestion under a daily lid
- 2005A 50-day average, a trendline break, and an open barrier flip
- 2005Matching a forty-day average to a crude trendline
- 2006Constructing a relative spread-strength oscillator for staged cycle confirmation
- 2006Constructing a log-change probability line for trend and range rules
- 2007Linked cross breaks as dollar-pair filters
- 2007A case study in support, resistance, and trendline role reversal on currency charts
- 2007Reading trendline breaks in a housing-sector case
- 2007Constructing replaceable trendlines for break signals
- 2007Reading trendline breaks before the mechanical signal
- 2007Trading choppy forex trends with channels and Fibonacci breaks
- 2007A stacked hypothesis from wave, trendline, ratio, and candle
- 2008Exit rules before entry: trendline, support, and stops
- 2008Capitulation headlines need trend confirmation
- 2008RSI divergence classes, ratio thresholds, and trendline tests
- 2010Support and resistance as falsifiable chart hypotheses
- 2012Reading a 2012 software directory as a breakout and channel case study
- 2013Treat a currency position as a regime, then map shared levels
- 2014Evaluating trendline swing size per market
- 2018Intermarket regime stress and the January 2018 trendline break
- 2018Weekly and daily Stochastic oscillator construction on a single daily chart
- 2018Constructing trendlines, support, and breakout targets from crowd exits
- 2019Trendline break and Fibonacci retracement as a falsifiable outlook check
- 2019Monthly S&P 500 false-break versus the decade trendline