1988issue C051-9
Stacked channel, trendline, and moving-average warnings in 1987
By August 1987 the advance was already aged on time, valuation, and a bond-equity split. This article teaches that top as a sequencing drill: upper-channel contact, a multi-tested trendline break, and a long moving-average violation had to fire together, while wave alternation rejected a copycat-correction story.
- Age the advance first with duration, valuation, and intermarket-divergence before reading later chart breaks as late-cycle warnings.
- Treat upper price-channel contact after a measured run as a completion test, then look for distribution-volume to finish the setup.
- Give more weight to a trendline that has already turned price several times; the October break near 2500 was the stronger warning for that reason.
- A sharp break of the 200-day moving average after years spent above it was read as a regime-change warning, and alternation was used to reject a replay of the prior dip.
A sequencing drill, not a single pattern
Editorial frame: read the 1987 top as an order of operations. First establish that time, valuation, and a bond-equity split have aged the advance. Then require three chart conditions to fire together: contact with the upper rail of a price-channel, a break of a multi-tested trendline, and a violation of a long moving average. Use elliott-wave alternation only to reject a copycat-correction story.
Age the advance first
By August 1987, after a five-year advance, historically high price-to-earnings ratios and very low dividend yields were treated as evidence that the longer bull phase was unusually extended and overvalued.
A turn toward monetary restraint early in 1987 coincided with peaking bond and Treasury-bill prices, while equities kept rising into August. The archive described that split as typically resolving with stocks following bonds lower. Editorial label: this is intermarket-divergence, and it belongs in the aging step, not in the trigger stack.
Breadth failed to confirm price on both intermediate and short-term horizons. The NYSE advance-decline line lagged new industrial highs, the OTC advance-decline line lagged its composite, and the industrial close at 2722 was unconfirmed by the transportation average. An advance-decline line is a running total of advancing minus declining issues used to test whether an index high is broadly confirmed.
Upper-channel contact and distribution-volume
The first three strong advances after the September 1985 low each lasted about 12 weeks. The fourth advance reached that same duration in the second week of August as the industrials near 2700 approached the upper parallel of an upward channel.
A price-channel is a pair of parallel support and resistance rails around an advance. Editorial reading: contact with the upper rail after that measured run is a completion test. It does not, by itself, complete the stack.
Volume on August 11-13 exceeded any earlier three-day stretch and was read as distribution after an already extended rally, completing the setup for a correction. That reading is distribution-volume: a surge in activity after an extended advance, taken as supply overwhelming demand rather than fresh sponsorship.
DJIA swing highs and lows into the 1987 crash
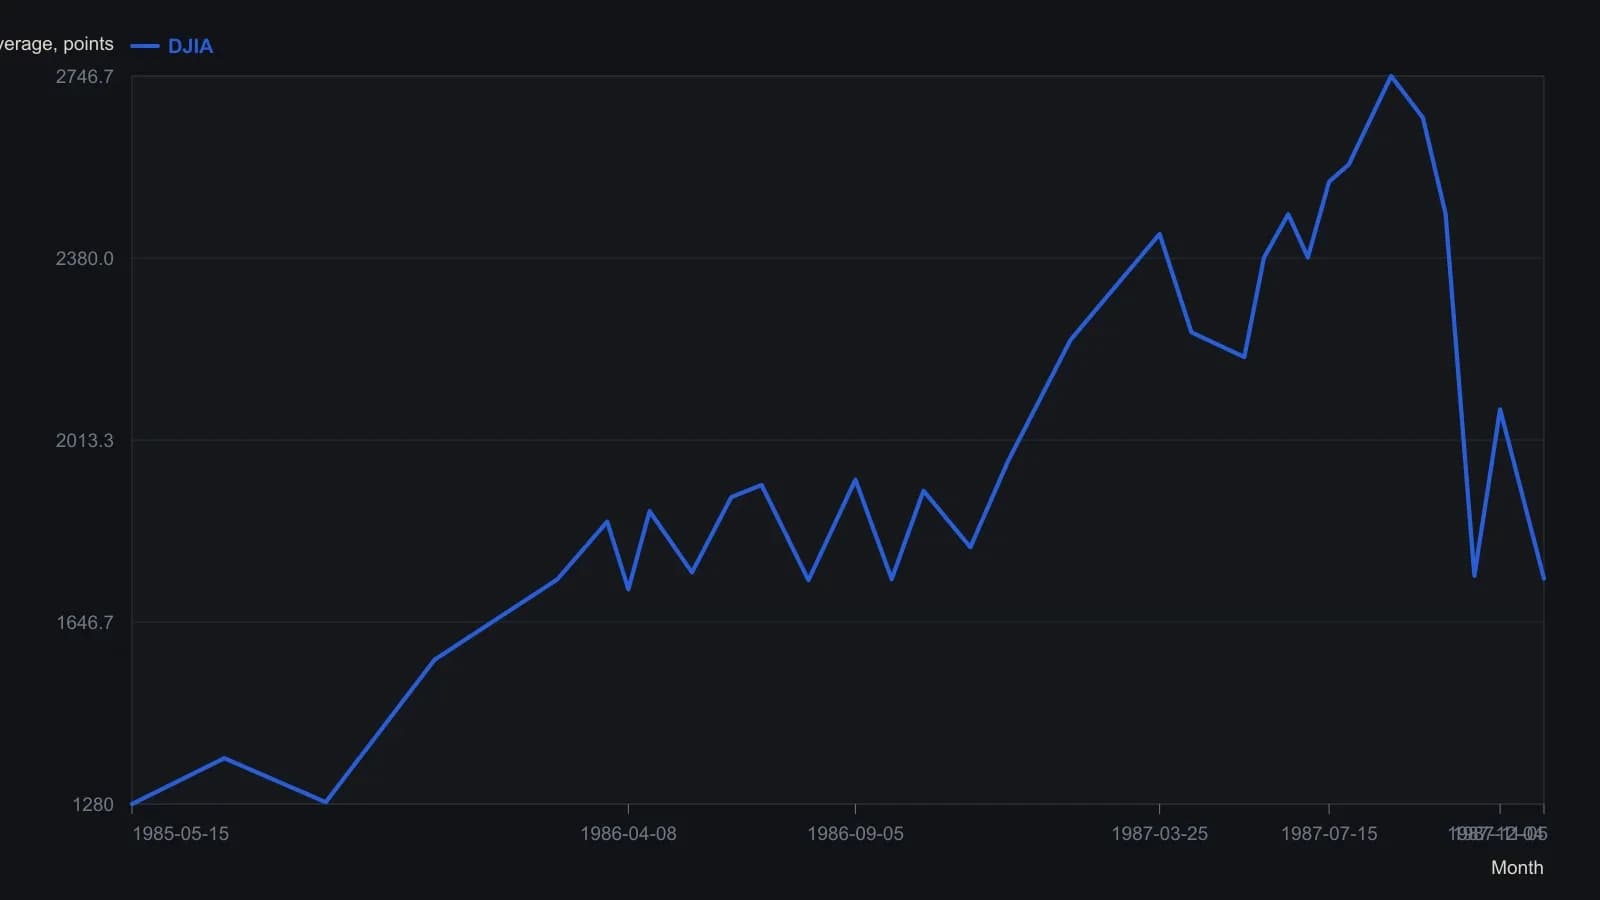
The source draws daily range bars with a 30-week average; only the printed swing highs and lows are carried over. The article’s stated August closing high is 2722; the plate annotates 2746.65 at that same peak. Two unlabeled anchors (May 1985 start, 19 October low) are read from the 100-point grid as whole numbers.
Weight the trendline by prior turns
After August, the industrials broke trendlines in early September and October. The October break of a four-point support line near 2500 was treated as the stronger warning because that line had already turned price four times.
A trendline is a straight boundary across successive turning points. Each additional rejection raises the weight given to a later penetration. The same trendline logic was illustrated by the August 1984 advance, which followed an S&P 500 break of a downward resistance line that had turned price seven times.
The long moving-average violation
In the second week of October 1987, a sharp drop through the 200-day moving average preceded the collapse by several days, after the industrials had generally held above that average for the previous three years. A sequence of that kind was also noted before 1929.
A moving average is a smoothed baseline of past closes over a fixed lookback. Editorial reading: a sharp break after years spent above it is a regime-change warning. In this drill it is the third required fire, not a substitute for the aging step or the channel and trendline tests.
Alternation against a copycat dip
By early October many participants treated a 91-point industrial decline as a routine bull-market dip and expected a replay of the March-May reaction that had been followed by a 500-point advance.
Wave-structure alternation was used to challenge that copycat view. Two consecutive corrections inside the same bull market were judged unlikely to trace the same pattern. Editorial restatement: elliott-wave alternation says consecutive corrections inside one advance are unlikely to take the same shape, so the March-May template was not accepted as the working map.
All readings on this track · 53 readings
- 1984Constructing the slow stochastic from a five-session range
- 1985Gold-proxy trendlines and a January support base
- 1988Construct a five-week new-highs total as a breadth chart
- 1988Stacked channel, trendline, and moving-average warnings in 1987
- 1989Auditing fifth-wave counts with equality, Fibonacci, and trendlines
- 1990Money-fund maturity as a companion Eurodollar chart
- 1990Constructing wave targets from ratios, triangles and trendlines
- 1992Nested time frames for trend and channel signals
- 1992A pre-trade checklist for trendline breaks and loss limits
- 1992Bond-fund timing inside trendlines, retracements, and dual averages
- 1992Two-point trendline construction from rise over run
- 1993Disposable chart ratings from confirmed level tests
- 1993When trend channels define fair value after dislocations
- 1993Valid trendline anchors for three-part reversals
- 1994Pairing stochastic divergence with trendline invalidation
- 1995Constructing measured targets after trendline breaks
- 1997A three-part pullback plan with RSI, Fibonacci retracements, and a tight trendline
- 1998Rule-based Trendline construction for testable entries
- 2000Constructing trendlines, breaks, and role reversal
- 2000Constructing speed resistance lines from trend extremes
- 2000Nasdaq tech cycle stages with a 15-day average and trendlines
- 2002Two-session candlesticks that test support, resistance, and trendlines
- 2002Constructing Fibonacci ratio grids from a peak and a trough
- 2002Evaluate trendline geometry before trusting a breakout
- 2002Trendline, volume, and breakout hypotheses versus cycle-end stories
- 2003Writing the long S&P 500 trendline and cycle junction as one hypothesis
- 2003A three-event trendline reversal checklist
- 2003Reverse-engineered Relative Strength Index price curves
- 2003Two-anchor trendline construction without cut-through
- 2004Treat a 15-minute e-mini stair-step as congestion under a daily lid
- 2005A 50-day average, a trendline break, and an open barrier flip
- 2005Matching a forty-day average to a crude trendline
- 2006Constructing a relative spread-strength oscillator for staged cycle confirmation
- 2006Constructing a log-change probability line for trend and range rules
- 2007Linked cross breaks as dollar-pair filters
- 2007A case study in support, resistance, and trendline role reversal on currency charts
- 2007Reading trendline breaks in a housing-sector case
- 2007Constructing replaceable trendlines for break signals
- 2007Reading trendline breaks before the mechanical signal
- 2007Trading choppy forex trends with channels and Fibonacci breaks
- 2007A stacked hypothesis from wave, trendline, ratio, and candle
- 2008Exit rules before entry: trendline, support, and stops
- 2008Capitulation headlines need trend confirmation
- 2008RSI divergence classes, ratio thresholds, and trendline tests
- 2010Support and resistance as falsifiable chart hypotheses
- 2012Reading a 2012 software directory as a breakout and channel case study
- 2013Treat a currency position as a regime, then map shared levels
- 2014Evaluating trendline swing size per market
- 2018Intermarket regime stress and the January 2018 trendline break
- 2018Weekly and daily Stochastic oscillator construction on a single daily chart
- 2018Constructing trendlines, support, and breakout targets from crowd exits
- 2019Trendline break and Fibonacci retracement as a falsifiable outlook check
- 2019Monthly S&P 500 false-break versus the decade trendline