1992issue C081-8
Pre-trade checklist for trendline and triangle signals
Treat a trendline under repeated pressure and a triangle of either slope as items in one pre-trade checklist. Write the chart-invalidation, the size, and the stand-aside condition before the first order, and keep that same procedure when the geometry changes.
- A pre-trade checklist is a written sequence that fixes entry, exit, size, and abstention before any order is placed.
- Chart-invalidation is the pre-specified structural change that would make the setup no longer valid, so the stop can sit at that chart point before entry.
- Repeated contact with a trendline is treated as a warning that the line may break, and a triangle-pattern of either slope is a directional hypothesis rather than a story after the fill.
- Equity-invariant-sizing applies at any account size, and a lighter commitment is advised when the market position is not clearly defined.
What the checklist writes down
A pre-trade checklist is a written sequence that fixes entry, exit, size, and abstention before any order is placed. In the archive workflow, a stop can be placed before entry at the chart point where the setup would no longer look valid. That point is the chart-invalidation: the pre-specified structural change that would make the setup no longer valid and therefore trigger the stop.
Rules that still need judgment
Discretionary trading still follows rules of attitude, approach, and personality, while mechanical trading still uses judgment for contract rolls, bet-size changes, and adding or dropping instruments. A compact operating set can require staying with the long-term trend, cutting losses, allowing profits to continue, and sizing the bet only as large as the operator can handle.
Trendline under repeated pressure
A trendline is a line along successive highs or lows that marks a directional constraint on price. Repeated contact with a minor or major trendline is treated as a warning that the line may break. A break of a minor line running against the major trend can be used as a stop-based place to take or reverse a position.
December 1991 lumber, mid-year to year-end
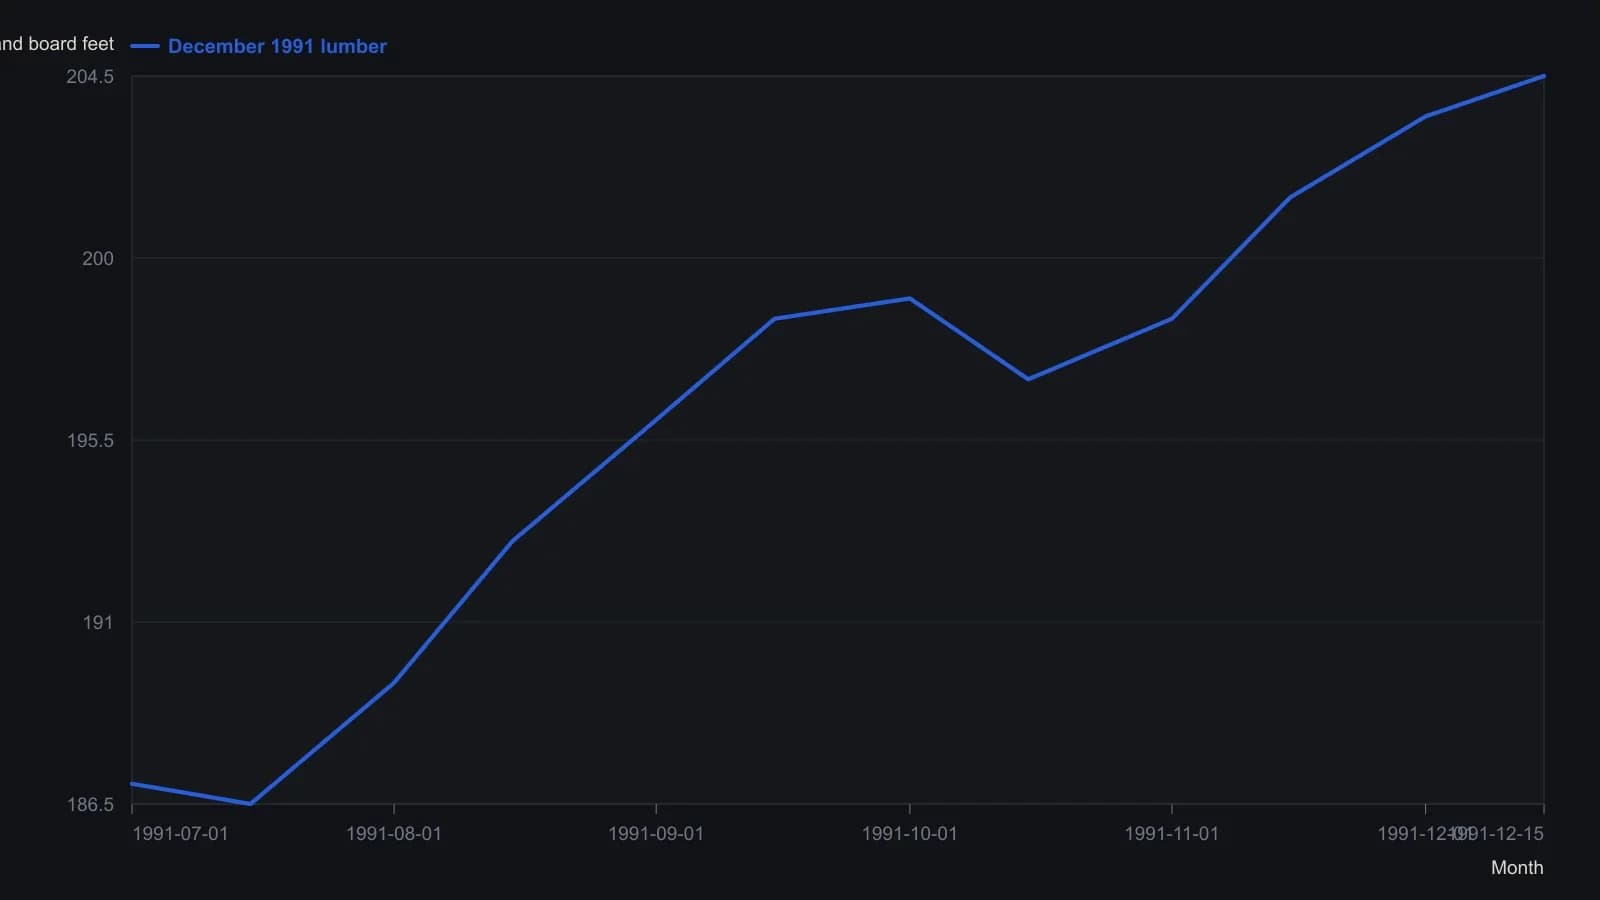
Prices are approximate closes taken from the printed daily bar chart; the raster does not support tick-level precision.
A triangle of either slope
A triangle-pattern is a contracting price structure whose break is treated as a directional hypothesis rather than a story after the fill. A triangle of either slope can represent accumulation or distribution depending on other conditions. It is often described as breaking on the flatter side, and stop orders can be related to triangular foci when they are tied to the chart formation.
Size and the stand-aside condition
When a market position is not clearly defined, a lighter commitment is advised, because concentrating on clearly signaled moves is presented as a way to reduce unprofitable whipsaws. Money-management logic can be treated as independent of a required starting stake, with the counterpart question being what equity level would force the trader to stop rather than what amount is needed to begin. Equity-invariant-sizing is that position-sizing logic: it applies at any account size instead of waiting for a required starting stake.
All readings on this track · 33 readings
- 1986Gold as a double zigzag before a contracting B-wave triangle
- 1990Scoring competing wave counts after a crash
- 1992Pre-trade checklist for trendline and triangle signals
- 1995Chart patterns as tactics, not strategy
- 1996Constructing Elliott wave counts with triangles and Fibonacci
- 1996A price-channel case study with a pending triangle signal and a planned stop-loss
- 1996Expanding triangle as a dual-label fourth-wave reversal worksheet
- 1997Rising wedge construction, breakout, and volume
- 1997Confirm structure and conditions before naming a Triangle pattern
- 1999Drawing the Triangle pattern before Breakout confirmation and the Stop-loss order
- 2000Four-phase market cycle triangle breakouts
- 2000Continuation triangles as a three-lock experiment
- 2001Folding rule: stacking three trendlines on an accelerating swing
- 2003A scored symmetrical triangle on a utility stock
- 2003Constructing wedges versus flat-boundary triangles
- 2004Testing triangle breakouts against volume filters
- 2004Mute triangles, histogram force, and trader optimization
- 2004Constructing falsifiable reversal and continuation patterns
- 2004Construct a corrective rising wedge before treating it as a short
- 2004A continuation triangle with Fibonacci targets and an apex stop
- 2005Pre-breakout filters for classic chart patterns
- 2005Reverse trendlines as a geometry lab for convergence and expanding triangles
- 2005Volume shapes versus triangle and double-pattern breakouts
- 2005A nested-pattern checklist on the 2005 euro
- 2005Volume test for a descending triangle breakout
- 2010Constructing triangle, broadening, and head and shoulders patterns
- 2011Treat a numeric pattern rank as a shortlist
- 2011Evaluating the head-and-shoulders as a falsifiable reversal
- 2013Auditing chart patterns by the first post-breakout swing
- 2014A three-gate entry for a triangle pullback
- 2014Golden triangle: a 50-day pause that still needs both gates
- 2014The triangle qualifier came after the rating pre-screen and the fifty-day bounce
- 2018Aligning daily, weekly, and monthly triangles with trendlines and Fibonacci retracements