2018issue C1224-29
Constructing trendlines, support, and breakout targets from crowd exits
Support, resistance, and trend activity are the three basic chart constructions used to read how many independent participants think about the next price. Editorial framing: build one falsifiable map. Draw the Trendline from successive bid and ask chases, mark the Support and resistance shelf from clustered profit or breakeven exits, then project the Breakout confirmation target from that same shelf.
- Support, resistance, and trend activity are the three basic chart constructions used to read how many independent participants think about the next price.
- The same clustered profit motive that builds a trend also builds the Trendline and Support and resistance levels later used as trade hypotheses.
- Independent exit rules can still stack at one price, and order-line bulges can confirm that Support and resistance cluster even though not every potential seller posts an order.
- A trading-band breakout target is constructed by measuring the height of the Support and resistance band and projecting that height in the breakout direction. The same width-projection construction is used on triangle breaks.
Three constructions, one participant map
Support, resistance, and trend activity are the three basic chart constructions used to read how many independent participants think about the next price.
The same clustered profit motive that builds a trend also builds the Trendline and Support and resistance levels later used as trade hypotheses.
Draw the Trendline from bid and ask chases
An uptrend is constructed when sellers lift offers expecting a better print and buyers raise bids to avoid missing the move, so successive matches step higher.
A downtrend is constructed when sellers cut offers to get out and buyers wait, so sellers come down to the bid and matches print lower.
Editorial note: those successive matches are the raw material for the Trendline. The line records the chase rather than standing as a separate shape pasted onto the chart.
Mark Support and resistance from clustered exits
A large group of entries near 100 plus a shared 10 percent exit plan can construct resistance near 110 because many holders independently treat 100 as the reference for a reasonable offer.
Independent exit rules can still stack at one price, and order-line bulges can confirm that Support and resistance cluster even though not every potential seller posts an order.
Prior support can flip into resistance when holders who sat through a drop later sell near the old breakeven, creating a recurring shelf from memory rather than from a new value calculation.
Editorial note: mark the shelf from that clustered profit or breakeven exit, then keep using the same shelf when the trade hypothesis is tested later.
Project the Breakout confirmation target from the same shelf
A breakout above a packed resistance zone can jump quickly when little supply sits between the common entry and the clustered profit-target offer.
After a breakout above resistance, pauses often appear near 10 percent, 20 percent, and 30 percent above that shelf, so those percentages are candidate projection levels rather than exact rules.
A trading-band breakout target is constructed by measuring the height of the Support and resistance band and projecting that height in the breakout direction. The same width-projection construction is used on triangle breaks.
Editorial note: Breakout confirmation is the test of that projected height or percentage pause against the shelf already drawn. The target extends the same map rather than adding a new shape.
Harvey Norman weekly shelves and measured breakout targets
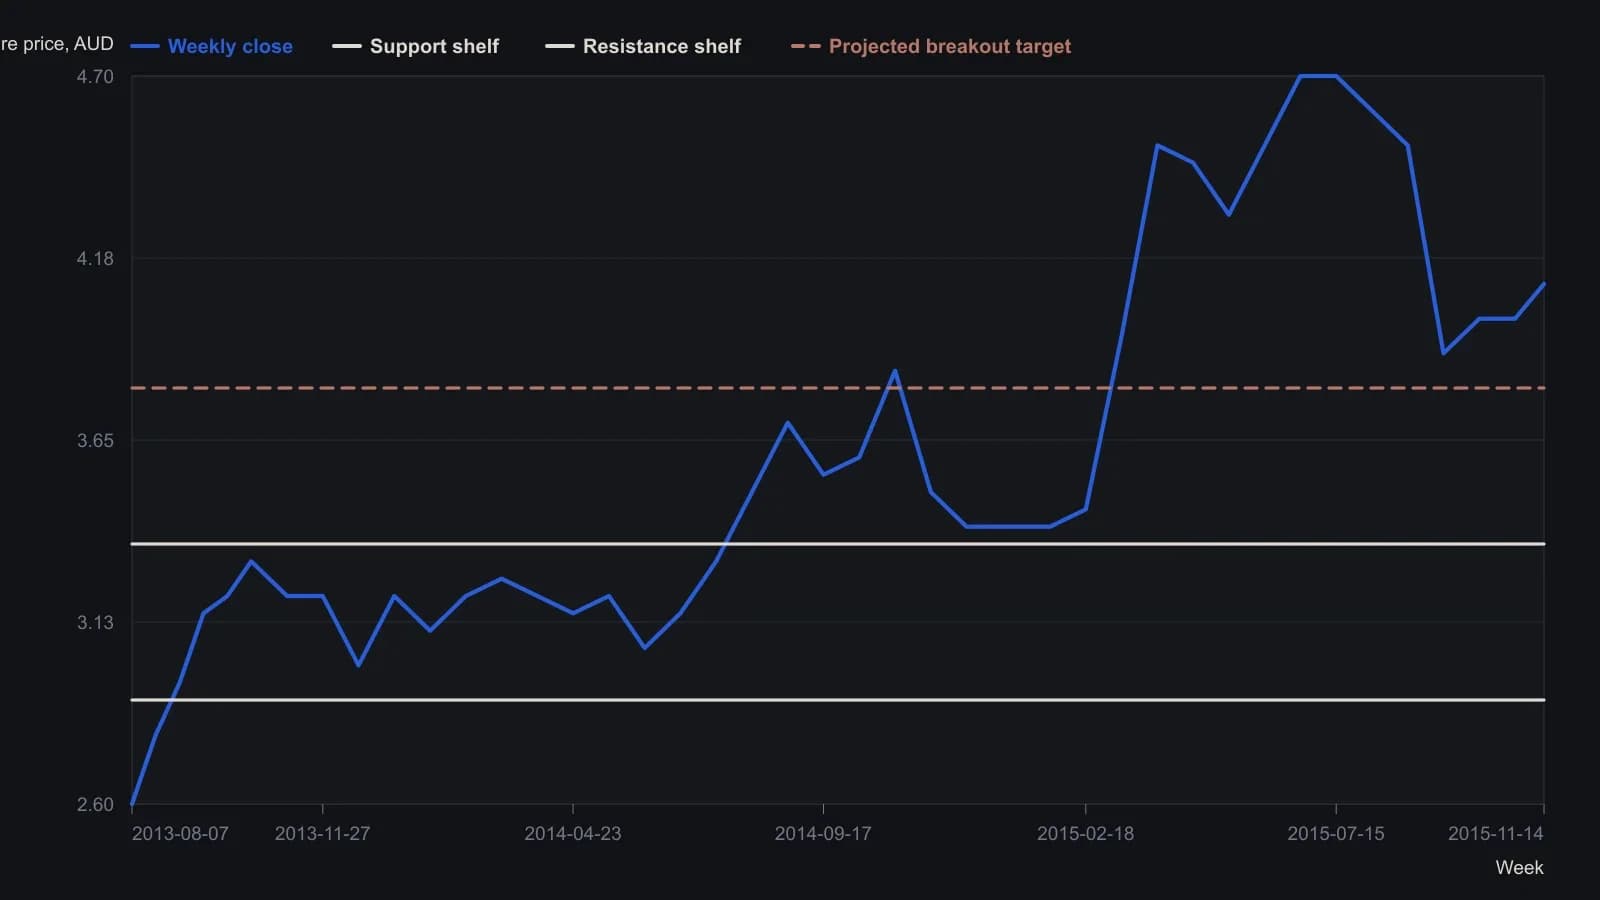
The source uses the first trading-band width as the measuring stick for each later target. Weekly closes are digitized to the nearest 0.05; wicks that only briefly pierce a shelf are not treated as closes.
All readings on this track · 53 readings
- 1984Constructing the slow stochastic from a five-session range
- 1985Gold-proxy trendlines and a January support base
- 1988Construct a five-week new-highs total as a breadth chart
- 1988Stacked channel, trendline, and moving-average warnings in 1987
- 1989Auditing fifth-wave counts with equality, Fibonacci, and trendlines
- 1990Money-fund maturity as a companion Eurodollar chart
- 1990Constructing wave targets from ratios, triangles and trendlines
- 1992Nested time frames for trend and channel signals
- 1992A pre-trade checklist for trendline breaks and loss limits
- 1992Bond-fund timing inside trendlines, retracements, and dual averages
- 1992Two-point trendline construction from rise over run
- 1993Disposable chart ratings from confirmed level tests
- 1993When trend channels define fair value after dislocations
- 1993Valid trendline anchors for three-part reversals
- 1994Pairing stochastic divergence with trendline invalidation
- 1995Constructing measured targets after trendline breaks
- 1997A three-part pullback plan with RSI, Fibonacci retracements, and a tight trendline
- 1998Rule-based Trendline construction for testable entries
- 2000Constructing trendlines, breaks, and role reversal
- 2000Constructing speed resistance lines from trend extremes
- 2000Nasdaq tech cycle stages with a 15-day average and trendlines
- 2002Two-session candlesticks that test support, resistance, and trendlines
- 2002Constructing Fibonacci ratio grids from a peak and a trough
- 2002Evaluate trendline geometry before trusting a breakout
- 2002Trendline, volume, and breakout hypotheses versus cycle-end stories
- 2003Writing the long S&P 500 trendline and cycle junction as one hypothesis
- 2003A three-event trendline reversal checklist
- 2003Reverse-engineered Relative Strength Index price curves
- 2003Two-anchor trendline construction without cut-through
- 2004Treat a 15-minute e-mini stair-step as congestion under a daily lid
- 2005A 50-day average, a trendline break, and an open barrier flip
- 2005Matching a forty-day average to a crude trendline
- 2006Constructing a relative spread-strength oscillator for staged cycle confirmation
- 2006Constructing a log-change probability line for trend and range rules
- 2007Linked cross breaks as dollar-pair filters
- 2007A case study in support, resistance, and trendline role reversal on currency charts
- 2007Reading trendline breaks in a housing-sector case
- 2007Constructing replaceable trendlines for break signals
- 2007Reading trendline breaks before the mechanical signal
- 2007Trading choppy forex trends with channels and Fibonacci breaks
- 2007A stacked hypothesis from wave, trendline, ratio, and candle
- 2008Exit rules before entry: trendline, support, and stops
- 2008Capitulation headlines need trend confirmation
- 2008RSI divergence classes, ratio thresholds, and trendline tests
- 2010Support and resistance as falsifiable chart hypotheses
- 2012Reading a 2012 software directory as a breakout and channel case study
- 2013Treat a currency position as a regime, then map shared levels
- 2014Evaluating trendline swing size per market
- 2018Intermarket regime stress and the January 2018 trendline break
- 2018Weekly and daily Stochastic oscillator construction on a single daily chart
- 2018Constructing trendlines, support, and breakout targets from crowd exits
- 2019Trendline break and Fibonacci retracement as a falsifiable outlook check
- 2019Monthly S&P 500 false-break versus the decade trendline