1994issue C011-8
Pairing stochastic divergence with trendline invalidation
A bullish or bearish price-oscillator split is a non-confirmation, not a standalone order. The archive workflow screens the pattern on a bounded slow stochastic, times the test on a %K cross of %D, and places invalidation at a swing extreme or trendline. TradersWeek editorial reading treats that split as unfinished until those three filters agree.
- A bullish split is price making a new low while the oscillator makes a higher low. A bearish split is price making a higher high while the oscillator makes a lower high.
- The confirming oscillator must already sit in an overbought or oversold band as the split begins to form, so incomplete or mid-range patterns can be discarded.
- On a 14-period slow stochastic, the split is read on the %D line and the hypothesis is timed only after the faster %K line crosses %D.
- After a split completes, invalidation is placed a few ticks beyond the pattern extreme, and a trendline break or later pullback to that line gives a second structure-defined place to test or abandon the hypothesis.
What counts as a split
A divergence is a non-confirmation in which price prints a new swing extreme while a related average or oscillator refuses the same extreme. It is used as an early-warning condition rather than a standalone order.
A bullish split is defined as price making a new low while the oscillator makes a higher low. A bearish split is defined as price making a higher high while the oscillator makes a lower high.
The same class of non-confirmation
When one price average records a new high and a related average cannot exceed its prior high, the strength of the prevailing primary trend is treated as unconfirmed.
Absent volume or open-interest expansion alongside a price trend is treated as the same class of non-confirmation as an oscillator that fails to ratify a new price extreme.
Screen with a bounded stochastic
A stochastic oscillator is a zero-to-one-hundred momentum reading whose slow %D line is compared with price for the split and whose faster %K cross later times the test.
Bounded oscillators that travel between 0 and 100 supply explicit extreme bands. Unbounded momentum histograms do not, which makes their splits harder to screen.
The overbought-oversold-screen is a requirement that the confirming oscillator already sit in an extreme band as the split begins to form, used to discard marginal patterns. A confirming oscillator is required to sit already in an overbought or oversold band as the split begins to form, so that incomplete or mid-range patterns can be discarded.
Time the test after the cross
On a 14-period slow stochastic, the split is read on the %D line and the hypothesis is timed only after the faster %K line crosses %D.
State where the hypothesis is wrong
After a split completes, invalidation is placed a few ticks beyond the pattern extreme: above the highest high for a bearish case and below the lowest low for a bullish case. Swing-extreme-invalidation is that protective level.
A trendline is a structural line that may break with a divergence, later act as a retest barrier, and supply a location for invalidation when the oscillator split is otherwise clean. A completed split can coincide with a trendline break or a later pullback to that same line, giving a second structure-defined place to test or abandon the hypothesis.
Price-oscillator splits carry no built-in measuring rule, so objectives and later stop-tightening come from other structure such as prior support, resistance, flags, or trendlines.
Sequences and scanner misses
Turning areas may print a sequence of splits rather than one two-swing ideal, so an early completed pattern can be stopped out before a later, cleaner split appears. Automated scanners can also mark false splits and miss obvious ones.
Merck May–July 1993: bearish split, stop, and the 33 test
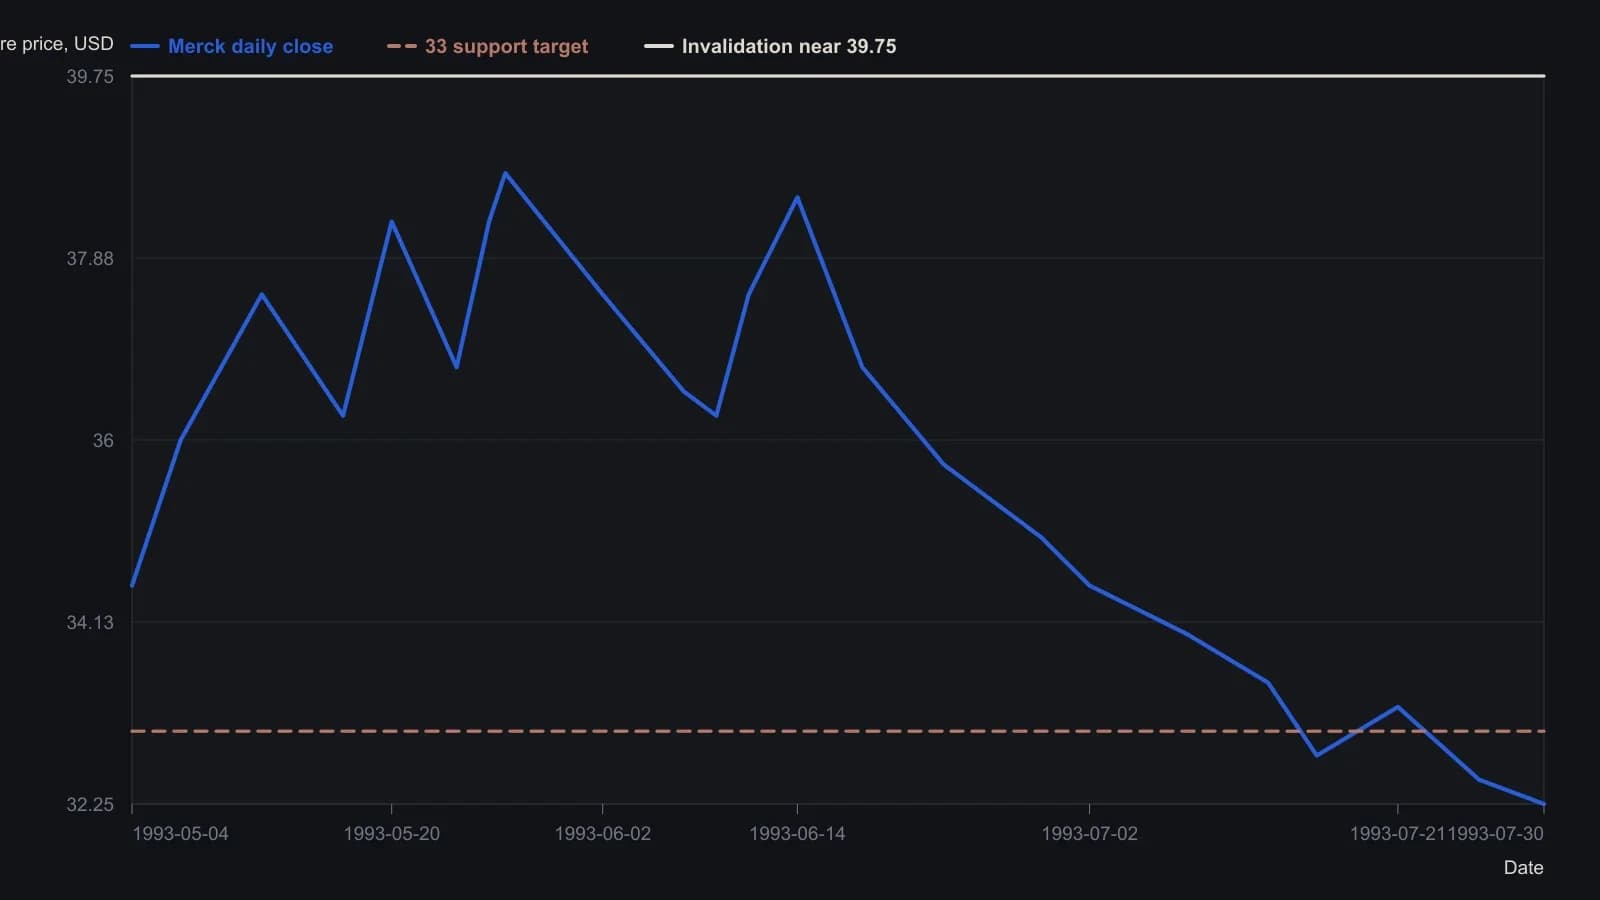
14-day slow stochastic. Dates follow the May–July axis; closes are nearest quarter-point from the daily OHLC raster. The 28.625 island-reversal low sits after this window.
All readings on this track · 53 readings
- 1984Constructing the slow stochastic from a five-session range
- 1985Gold-proxy trendlines and a January support base
- 1988Construct a five-week new-highs total as a breadth chart
- 1988Stacked channel, trendline, and moving-average warnings in 1987
- 1989Auditing fifth-wave counts with equality, Fibonacci, and trendlines
- 1990Money-fund maturity as a companion Eurodollar chart
- 1990Constructing wave targets from ratios, triangles and trendlines
- 1992Nested time frames for trend and channel signals
- 1992A pre-trade checklist for trendline breaks and loss limits
- 1992Bond-fund timing inside trendlines, retracements, and dual averages
- 1992Two-point trendline construction from rise over run
- 1993Disposable chart ratings from confirmed level tests
- 1993When trend channels define fair value after dislocations
- 1993Valid trendline anchors for three-part reversals
- 1994Pairing stochastic divergence with trendline invalidation
- 1995Constructing measured targets after trendline breaks
- 1997A three-part pullback plan with RSI, Fibonacci retracements, and a tight trendline
- 1998Rule-based Trendline construction for testable entries
- 2000Constructing trendlines, breaks, and role reversal
- 2000Constructing speed resistance lines from trend extremes
- 2000Nasdaq tech cycle stages with a 15-day average and trendlines
- 2002Two-session candlesticks that test support, resistance, and trendlines
- 2002Constructing Fibonacci ratio grids from a peak and a trough
- 2002Evaluate trendline geometry before trusting a breakout
- 2002Trendline, volume, and breakout hypotheses versus cycle-end stories
- 2003Writing the long S&P 500 trendline and cycle junction as one hypothesis
- 2003A three-event trendline reversal checklist
- 2003Reverse-engineered Relative Strength Index price curves
- 2003Two-anchor trendline construction without cut-through
- 2004Treat a 15-minute e-mini stair-step as congestion under a daily lid
- 2005A 50-day average, a trendline break, and an open barrier flip
- 2005Matching a forty-day average to a crude trendline
- 2006Constructing a relative spread-strength oscillator for staged cycle confirmation
- 2006Constructing a log-change probability line for trend and range rules
- 2007Linked cross breaks as dollar-pair filters
- 2007A case study in support, resistance, and trendline role reversal on currency charts
- 2007Reading trendline breaks in a housing-sector case
- 2007Constructing replaceable trendlines for break signals
- 2007Reading trendline breaks before the mechanical signal
- 2007Trading choppy forex trends with channels and Fibonacci breaks
- 2007A stacked hypothesis from wave, trendline, ratio, and candle
- 2008Exit rules before entry: trendline, support, and stops
- 2008Capitulation headlines need trend confirmation
- 2008RSI divergence classes, ratio thresholds, and trendline tests
- 2010Support and resistance as falsifiable chart hypotheses
- 2012Reading a 2012 software directory as a breakout and channel case study
- 2013Treat a currency position as a regime, then map shared levels
- 2014Evaluating trendline swing size per market
- 2018Intermarket regime stress and the January 2018 trendline break
- 2018Weekly and daily Stochastic oscillator construction on a single daily chart
- 2018Constructing trendlines, support, and breakout targets from crowd exits
- 2019Trendline break and Fibonacci retracement as a falsifiable outlook check
- 2019Monthly S&P 500 false-break versus the decade trendline