1990issue C031-9
Money-fund maturity as a companion Eurodollar chart
Weekly average maturity can be drawn with the same channels, support and resistance, and trendline breaks used on Eurodollar futures. A short moving average on that weekly series then marks when the direction of maturity, not the raw day-count, has changed.
- Plot weekly average maturity beside Eurodollar futures and apply the same maturity channels, support and resistance, and trendlines to both series.
- In the first-half 1982 30- to 33-day channel, Eurodollar futures tended to rally near the 30-day lower bound and fade when maturity reached 32 to 33 days, and a July extension to 34 and then 36 days came before the August break above 86.00.
- A maturity-price divergence, such as the 35- to 40-day sideways maturity range against lower Eurodollar lows from early 1983 into 1984, is a condition the archive treated as meaningful once a later joint trendline break confirmed it.
- Judge the direction of the average-maturity line, not the day-count itself, and require a maturity moving average plus a two-to-four-day minimum day-change before calling a new short- or intermediate-term maturity trend.
Read average maturity as a second price chart
Weekly average maturity is the typical remaining life, in days, of instruments held by taxable money market funds. Plot that series next to Eurodollar futures and treat it as a second price chart. Eurodollar futures is a short-rate contract whose price moves inversely with expected dollar deposit yields, so the same trendlines, support and resistance, and horizontal bands used on the futures can be drawn on the maturity series.
A multi-month horizontal band on the average-maturity chart is a maturity channel, read like a price range. A violation of a multi-month or multi-year line through successive highs or lows is a trendline break, and it can appear on either series. A lengthening of fund average maturity is a maturity extension, a more defensive stance toward falling short rates. A reduction is a maturity shortening, a more defensive stance toward rising short rates.
Average maturity of taxable money-market funds, 1980–1990
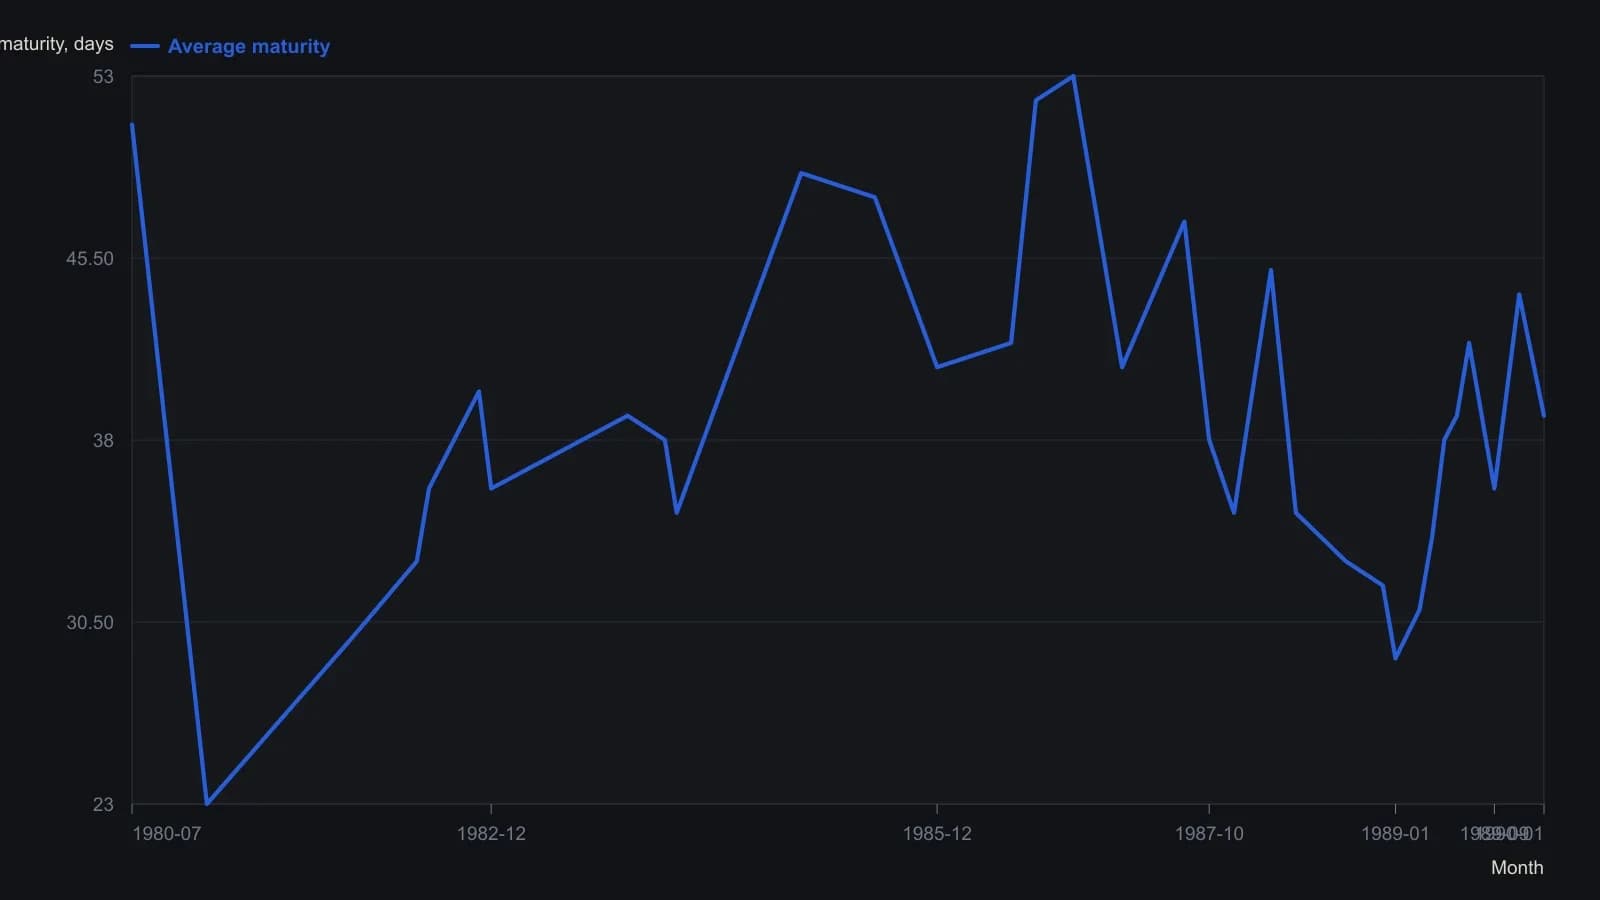
Weekly Donohue Money Fund Report series. The printed weekly line wiggles between these turning points; only levels the article states are plotted. Mancher wants a two- or three-day change before calling a new trend, and treats most December shortenings as seasonal.
The 1982 maturity channel
In the first half of 1982 the average-maturity series held a 30- to 33-day band. That maturity channel functioned as support near 30 days and as resistance near 32 to 33 days. Eurodollar futures tended to rally on dips to the lower bound and to fade toward the lower end of their range when maturities reached the upper bound.
A mid- to late-July 1982 maturity extension carried average maturity to 34 and then 36 days before Eurodollar futures broke above 86.00 in August. After that break, maturities were gradually extended toward 39 to 40 days by late 1982.
When the two series stop leading
By late May 1983 both Eurodollar futures and average maturity resembled a triple-top pattern. Eurodollars failed to make significantly higher ground on a third rally attempt, and fund managers then shortened maturities. For the rest of 1983, maturity moved between 35 and 39 days while Eurodollars ranged between 89 and 90. In that stretch the two series tended to coincide rather than lead.
Divergence, then a shared break
From early 1983 to mid-1984, Eurodollar futures printed a series of lower lows while average maturity held a 35- to 40-day sideways range through September 1984. The archive treated that pairing as a bullish maturity-price divergence because managers did not shorten further despite the futures downtrend.
In October 1984, Eurodollar futures broke a 1.5-year downtrend at the same time average maturity rose through the 38- to 40-day resistance that had capped the prior two years. The futures advance continued until a peak near 91.30 that coincided to the week with a 49-day peak in average maturity in January 1985.
Later trendline breaks and the 1987 lead
A three-year uptrend line of lengthening maturities was violated in December 1983 and again in March 1984. A gradual six-year trend of lengthening average maturities was violated in early 1987 while Eurodollars were still near multiyear highs. The archive also noted a break of both the five-month and the 13-month downtrend lines in Eurodollar futures as pointing to further futures gains.
From a 42-day low in June 1986, average maturity was extended to 52 days by August. That move broke a 48- to 49-day resistance band that had held for 1.5 years and exceeded the mid-1980 extreme of 51 days. Average maturity then reached 53 days in November 1986 even though Eurodollars had not made new highs for several months.
Managers steadily reduced maturities from late 1986 into March 1987, and that maturity shortening was already under way before the February 1987 breakdown in Eurodollar prices. They later shortened taxable-fund maturity from 47 to 38 days in the two months before October 1987. For much of 1987, average maturity appeared on the chart to move about a week or two ahead of Eurodollar prices.
Confirm a change of direction
The archive recommended a maturity moving average on the weekly series specifically to mark a change in the trend of average maturity, not to interpret the day-count as a standalone level. The accompanying filter was a minimum day-change of two or three days, or a more conservative three or four days, before a new short- to intermediate-term maturity trend was called.
Editorial reading
TradersWeek editorial reading: once the weekly maturity series is drawn as a second chart, the job is to make it falsifiable. Use the same maturity channels, support and resistance, and trendline breaks already familiar on Eurodollar futures, then let a short maturity moving average and a two-to-four-day minimum day-change confirm that the direction of average maturity has changed. The day-count is the scale of the chart, not the signal.
All readings on this track · 53 readings
- 1984Constructing the slow stochastic from a five-session range
- 1985Gold-proxy trendlines and a January support base
- 1988Construct a five-week new-highs total as a breadth chart
- 1988Stacked channel, trendline, and moving-average warnings in 1987
- 1989Auditing fifth-wave counts with equality, Fibonacci, and trendlines
- 1990Money-fund maturity as a companion Eurodollar chart
- 1990Constructing wave targets from ratios, triangles and trendlines
- 1992Nested time frames for trend and channel signals
- 1992A pre-trade checklist for trendline breaks and loss limits
- 1992Bond-fund timing inside trendlines, retracements, and dual averages
- 1992Two-point trendline construction from rise over run
- 1993Disposable chart ratings from confirmed level tests
- 1993When trend channels define fair value after dislocations
- 1993Valid trendline anchors for three-part reversals
- 1994Pairing stochastic divergence with trendline invalidation
- 1995Constructing measured targets after trendline breaks
- 1997A three-part pullback plan with RSI, Fibonacci retracements, and a tight trendline
- 1998Rule-based Trendline construction for testable entries
- 2000Constructing trendlines, breaks, and role reversal
- 2000Constructing speed resistance lines from trend extremes
- 2000Nasdaq tech cycle stages with a 15-day average and trendlines
- 2002Two-session candlesticks that test support, resistance, and trendlines
- 2002Constructing Fibonacci ratio grids from a peak and a trough
- 2002Evaluate trendline geometry before trusting a breakout
- 2002Trendline, volume, and breakout hypotheses versus cycle-end stories
- 2003Writing the long S&P 500 trendline and cycle junction as one hypothesis
- 2003A three-event trendline reversal checklist
- 2003Reverse-engineered Relative Strength Index price curves
- 2003Two-anchor trendline construction without cut-through
- 2004Treat a 15-minute e-mini stair-step as congestion under a daily lid
- 2005A 50-day average, a trendline break, and an open barrier flip
- 2005Matching a forty-day average to a crude trendline
- 2006Constructing a relative spread-strength oscillator for staged cycle confirmation
- 2006Constructing a log-change probability line for trend and range rules
- 2007Linked cross breaks as dollar-pair filters
- 2007A case study in support, resistance, and trendline role reversal on currency charts
- 2007Reading trendline breaks in a housing-sector case
- 2007Constructing replaceable trendlines for break signals
- 2007Reading trendline breaks before the mechanical signal
- 2007Trading choppy forex trends with channels and Fibonacci breaks
- 2007A stacked hypothesis from wave, trendline, ratio, and candle
- 2008Exit rules before entry: trendline, support, and stops
- 2008Capitulation headlines need trend confirmation
- 2008RSI divergence classes, ratio thresholds, and trendline tests
- 2010Support and resistance as falsifiable chart hypotheses
- 2012Reading a 2012 software directory as a breakout and channel case study
- 2013Treat a currency position as a regime, then map shared levels
- 2014Evaluating trendline swing size per market
- 2018Intermarket regime stress and the January 2018 trendline break
- 2018Weekly and daily Stochastic oscillator construction on a single daily chart
- 2018Constructing trendlines, support, and breakout targets from crowd exits
- 2019Trendline break and Fibonacci retracement as a falsifiable outlook check
- 2019Monthly S&P 500 false-break versus the decade trendline