2003issue C021-4
Writing the long S&P 500 trendline and cycle junction as one hypothesis
A completed monthly S&P 500 chart is used as a classroom for writing a broken long-horizon trendline, a five-year head-and-shoulders neckline, and a dated cycle template as one falsifiable regime hypothesis instead of a bottom-calling contest.
- The source presents technical analysis as resting on three working assumptions: that markets discount available information, that prices move in trends, and that historical patterns tend to recur in kind rather than as identical copies.
- On the monthly S&P 500 chart, an uptrend line from the 1982 low is described as broken in mid-2002, while a five-year head-and-shoulders neckline in the 950 to 960 area is treated as the level that turns a buy-on-dips long into a losing trade.
- A Nikkei post-bubble path and a 54-year trough-to-trough cycle are used as dated dominant-cycle baselines for how long a post-2000 regime might last, not as a day-to-day timing clock.
- Attempting to catch the exact low tick is treated as futile. The stated bullish alternative is a new uptrend with two points to form a trendline, or a monthly close above 980.
Three working assumptions
The source presents technical analysis as resting on three working assumptions: that markets discount available information, that prices move in trends, and that historical patterns tend to recur in kind rather than as identical copies.
The source treats a trendline break in a widely followed stock as information that typically reaches only chart-using participants, in contrast to an earnings surprise that is expected to be noticed by the whole market.
The broken 1982 uptrend line
On a monthly S&P 500 chart spanning 1987 to the then-present, an uptrend line drawn from the 1982 low is described as broken in mid-2002, with the June decline placing the index clearly beneath that dominant trend.
A trendline is a straight line drawn through successive lows or highs that turns a visible price path into a testable condition: stay above it and the prior regime remains intact; close through it and that hypothesis is rejected.
A five-year head-and-shoulders neckline
The same monthly chart is annotated as a five-year head-and-shoulders reversal whose neckline sits in the 950 to 960 area. A break of that neckline is presented as the point at which a buy-on-dips long position becomes a losing trade.
The head-and-shoulders is a three-peak reversal geometry whose left shoulder, head, and right shoulder sit above a neckline. A close through that neckline converts the pattern from description into a failed-uptrend case. The neckline is the support line connecting the lows between the two shoulders and, in this case study, the decision level that separates a still-salvageable dip from a completed reversal.
The source reconstructs the psychology of the formation as successive failed attempts at new highs after the left shoulder and head, with a buy-and-hold participant adding on each dip until the right-shoulder failure and neckline break leave only selling at a loss or waiting much longer.
When buy-on-dips meets a completed reversal
Buy-on-dips behavior that had worked for nearly 15 years is illustrated with the 1998 Asian-crisis pullback, after which the market is said to have declined for only one month before the later top remained non-obvious into late 2000 and 2001.
Buy-on-dips is the habit of adding exposure on pullbacks that worked while a long uptrend stayed intact, and that becomes the mechanism of loss once a reversal geometry completes.
Monthly S&P 500, 1987–2002, versus the 955 breakdown
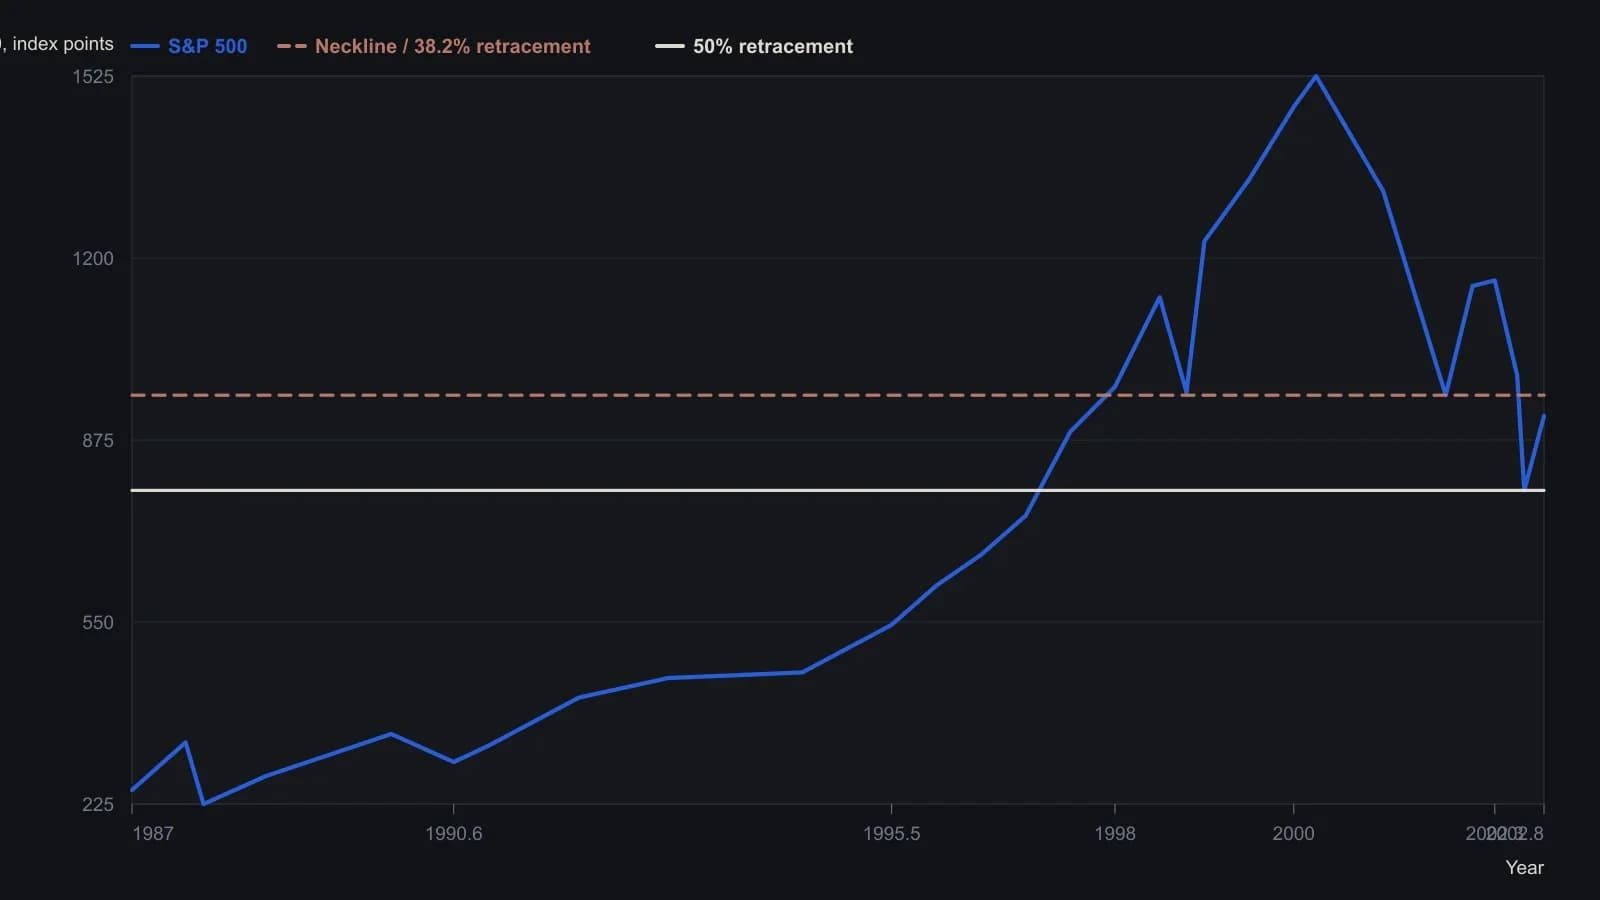
Fibonacci percentages follow the author’s span from the 1962 low to the 2000 high. Intermediate monthly points are digitized from the candlesticks and rounded to about five index points except for quoted prints. The 1982 uptrend line begins off the left of the frame and is not plotted.
Dated baselines for a post-bubble path
The source uses the Nikkei's rise above 30,000 and a subsequent multi-year deflation of that bubble, lasting more than 10 years without a resumed bull trend, as a historical template for a post-2000 US regime that could last until at least 2010 if a similar 10-year path is assumed from the 2000 peak.
A 54-year trough-to-trough Kondratieff cycle applied to a 1960 low is used as a second dated baseline, placing a comparable trough around 2014. The source notes that overlaying the 10-year Nikkei template already reaches about 50 years through that cycle by 2010.
A dominant-cycle, as used here, is a historically observed interval between comparable market or economic turning points. It is a dated baseline for how long a post-bubble regime might last rather than a day-to-day timing tool.
Evidence that a new uptrend has begun
Two dominant downtrend lines are cited as defining the then-current market direction. The source argues that attempting to catch the exact low tick is futile. A constructive alternative is waiting for a new uptrend with two points to form a trendline, or a monthly close above 980, as a bullish signal.
That monthly close is a monthly-close-threshold: a pre-stated higher-timeframe confirmation used to define what would count as evidence that a new uptrend has begun.
All readings on this track · 53 readings
- 1984Constructing the slow stochastic from a five-session range
- 1985Gold-proxy trendlines and a January support base
- 1988Construct a five-week new-highs total as a breadth chart
- 1988Stacked channel, trendline, and moving-average warnings in 1987
- 1989Auditing fifth-wave counts with equality, Fibonacci, and trendlines
- 1990Money-fund maturity as a companion Eurodollar chart
- 1990Constructing wave targets from ratios, triangles and trendlines
- 1992Nested time frames for trend and channel signals
- 1992A pre-trade checklist for trendline breaks and loss limits
- 1992Bond-fund timing inside trendlines, retracements, and dual averages
- 1992Two-point trendline construction from rise over run
- 1993Disposable chart ratings from confirmed level tests
- 1993When trend channels define fair value after dislocations
- 1993Valid trendline anchors for three-part reversals
- 1994Pairing stochastic divergence with trendline invalidation
- 1995Constructing measured targets after trendline breaks
- 1997A three-part pullback plan with RSI, Fibonacci retracements, and a tight trendline
- 1998Rule-based Trendline construction for testable entries
- 2000Constructing trendlines, breaks, and role reversal
- 2000Constructing speed resistance lines from trend extremes
- 2000Nasdaq tech cycle stages with a 15-day average and trendlines
- 2002Two-session candlesticks that test support, resistance, and trendlines
- 2002Constructing Fibonacci ratio grids from a peak and a trough
- 2002Evaluate trendline geometry before trusting a breakout
- 2002Trendline, volume, and breakout hypotheses versus cycle-end stories
- 2003Writing the long S&P 500 trendline and cycle junction as one hypothesis
- 2003A three-event trendline reversal checklist
- 2003Reverse-engineered Relative Strength Index price curves
- 2003Two-anchor trendline construction without cut-through
- 2004Treat a 15-minute e-mini stair-step as congestion under a daily lid
- 2005A 50-day average, a trendline break, and an open barrier flip
- 2005Matching a forty-day average to a crude trendline
- 2006Constructing a relative spread-strength oscillator for staged cycle confirmation
- 2006Constructing a log-change probability line for trend and range rules
- 2007Linked cross breaks as dollar-pair filters
- 2007A case study in support, resistance, and trendline role reversal on currency charts
- 2007Reading trendline breaks in a housing-sector case
- 2007Constructing replaceable trendlines for break signals
- 2007Reading trendline breaks before the mechanical signal
- 2007Trading choppy forex trends with channels and Fibonacci breaks
- 2007A stacked hypothesis from wave, trendline, ratio, and candle
- 2008Exit rules before entry: trendline, support, and stops
- 2008Capitulation headlines need trend confirmation
- 2008RSI divergence classes, ratio thresholds, and trendline tests
- 2010Support and resistance as falsifiable chart hypotheses
- 2012Reading a 2012 software directory as a breakout and channel case study
- 2013Treat a currency position as a regime, then map shared levels
- 2014Evaluating trendline swing size per market
- 2018Intermarket regime stress and the January 2018 trendline break
- 2018Weekly and daily Stochastic oscillator construction on a single daily chart
- 2018Constructing trendlines, support, and breakout targets from crowd exits
- 2019Trendline break and Fibonacci retracement as a falsifiable outlook check
- 2019Monthly S&P 500 false-break versus the decade trendline