2007issue C121-4
A stacked hypothesis from wave, trendline, ratio, and candle
Editorial reading: this archive note treats the chart as a pre-trade scenario board, not a single market verdict. An A-B boundary, nested trendlines, and Fibonacci ratios set the test. A named candlestick print is the only trigger that turns those stacked conditions into a hypothesis that can be accepted or rejected before an order is considered.
- Control inside an A-B boundary requires a higher low and a rally through the B edge in an advance, and the reverse conditions in a decline.
- Inner, outer, and long-term trendlines locate the wave and site protective exits, while listed Fibonacci retracement and extension ratios mark the pullback test and the later exhaustion zone.
- A named candlestick entry print is the last confirmation. Editorial reading: that print is what turns stacked conditions into a hypothesis that can be accepted or rejected.
- A written checklist of entry and exit criteria, prepared before a position is opened, keeps alternative scenarios mapped if the first reading fails.
A board of conditions, not a market verdict
Editorial reading: this archive note is more useful as a pre-trade scenario board than as a search for a single market verdict. The A-B wave locates where control is being contested. The trendline states what would invalidate that control. Fibonacci ratios mark the pullback test. A named candlestick print is the only trigger that turns those stacked conditions into a hypothesis that can be accepted or rejected before an order is considered.
A seven-item technical checklist is outlined for decisions in rising, falling, or sideways markets. Only the A-B boundary, Fibonacci retracement, and candlestick entry are developed in detail.
The A-B boundary locates contested control
An A-B boundary is the latest swing interval in a price wave. Control inside that interval is described as requiring a higher low and a rally through the B edge in an advance, and the reverse conditions in a decline. One side must hold those tests, or meet the inverse conditions in a decline, to keep control of the interval.
Nested trendlines state invalidation
Rising trendlines are drawn through support and falling trendlines through resistance. Inner, outer, and long-term lines are named as the three scales used to locate the wave and site protective exits.
Inner-outer-long-term trendlines are the three nested support or resistance lines used to locate the active wave, mark invalidation, and trail an open idea as price develops. Editorial reading: the lines do not add a second market opinion. They state in advance which break would cancel the control reading taken from the A-B boundary.
Fibonacci ratios mark the test and the later objective
A Fibonacci retracement applies listed ratios to a completed swing to mark where a pullback may stall before the prior direction resumes. The ratios listed for monitoring are 0.382, 0.50, 0.618, 0.786, and 0.86.
A Fibonacci extension projects listed ratios beyond a completed swing to mark where a resumed move may exhaust and start a new A-B cycle. The extension ratios listed are 1.18, 1.27, 1.618, and 2.618.
In the illustrated advance, the test is placed at the 0.618 retracement labeled C, and the exhaustion zone is projected just ahead of the 1.618 extension labeled D. The next major pullback is said to start a new A-B-C-D sequence. The ratio at which a pullback holds is used to select which extension becomes the subsequent objective, and the same mapping is inverted in a decline.
GBP/USD Fibonacci tests from A–B through the D extension
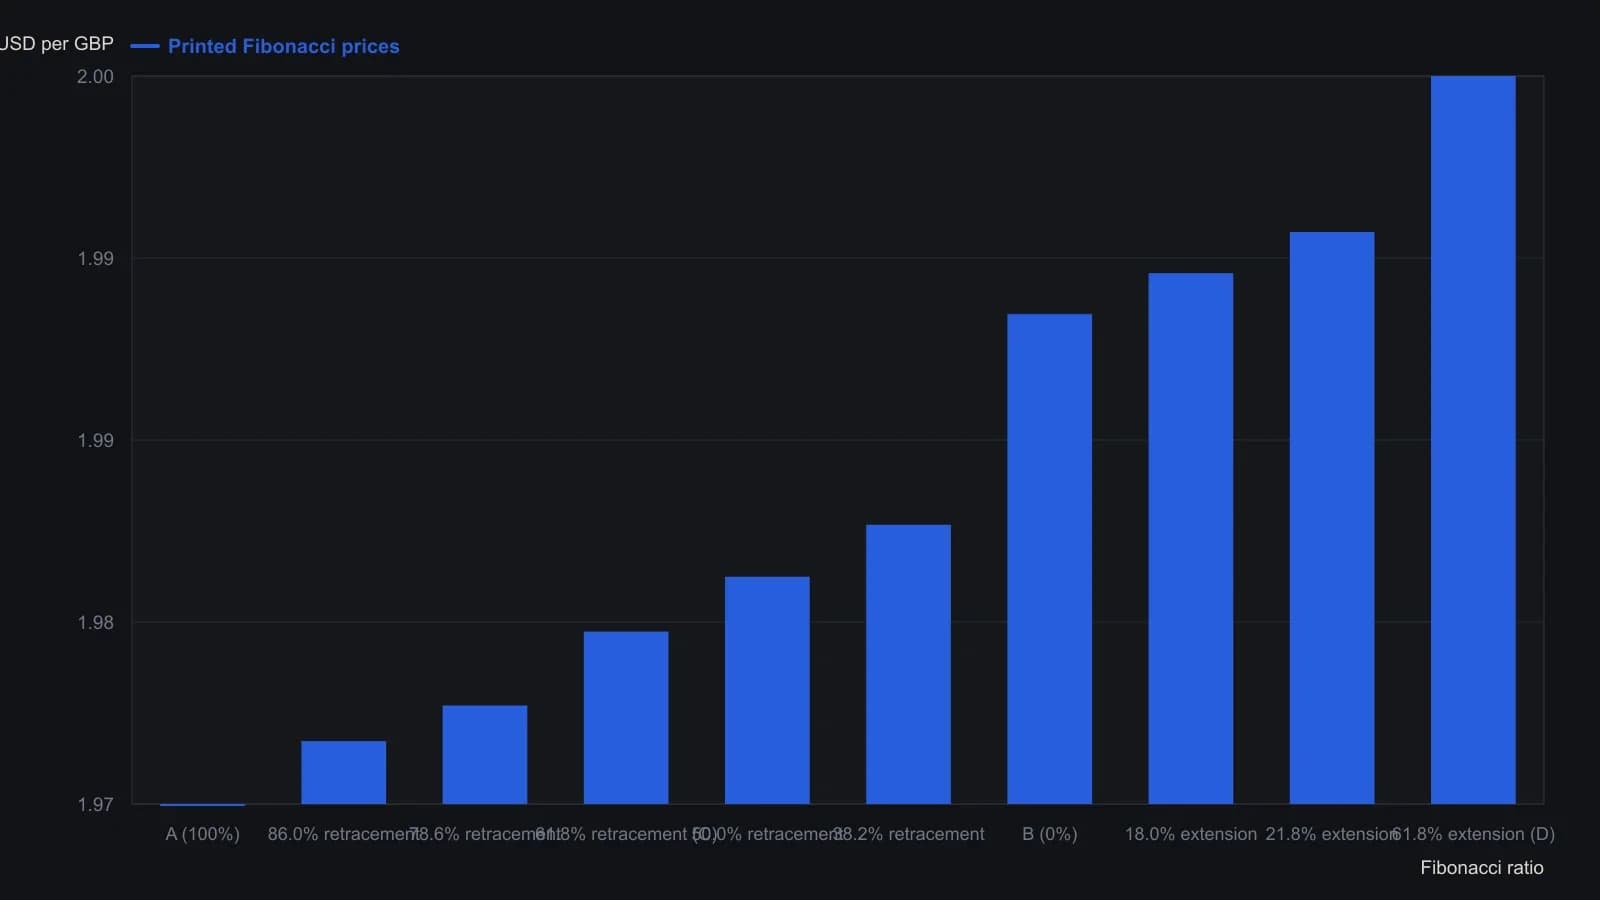
Prices are the Fibonacci tags printed on the source figure, not a fitted curve. Above B the package marks 18.0 at 1.9916, 21.8 at 1.9931, and 61.8 at 1.9988; that last tag is the 1.618 extension the article treats as D.
A candlestick entry print is the last confirmation
Engulfing bars, tweezer tops and bottoms, and evening or morning stars are treated as turning-point prints that appear from 15-minute through monthly charts. A signal on a daily or eight-hour chart is presented as permission to act on a shorter chart.
Bullish engulfing prints, a tweezer bottom, and a morning star are sought in advances as signs a pullback may be ending. Bearish engulfing prints, a tweezer top, and evening stars are sought in declines as signs a bounce may be ending.
A candlestick entry print is a named reversal formation used as the last confirmation that a test of support or resistance may be finishing. Editorial reading: without that print, the stacked conditions are not yet a hypothesis that can be accepted or rejected.
Trading convergence and mapped alternatives
A worked combination is described as a morning star holding an uptrend line at the 0.618 retracement. That setup is labeled a convergence because two or more independent reasons occupy the same test. Trading convergence is that overlap: two or more independent chart conditions occupying the same price area, such as a reversal candle at a trendline and a retracement ratio.
A written checklist of entry and exit criteria, prepared before a position is opened, is presented as the structure that keeps alternative scenarios mapped if the first reading fails. Editorial reading: a daily or eight-hour print that permits work on a shorter chart does not erase a contrary reading on another scale. Both belong on the same checklist.
All readings on this track · 53 readings
- 1984Constructing the slow stochastic from a five-session range
- 1985Gold-proxy trendlines and a January support base
- 1988Construct a five-week new-highs total as a breadth chart
- 1988Stacked channel, trendline, and moving-average warnings in 1987
- 1989Auditing fifth-wave counts with equality, Fibonacci, and trendlines
- 1990Money-fund maturity as a companion Eurodollar chart
- 1990Constructing wave targets from ratios, triangles and trendlines
- 1992Nested time frames for trend and channel signals
- 1992A pre-trade checklist for trendline breaks and loss limits
- 1992Bond-fund timing inside trendlines, retracements, and dual averages
- 1992Two-point trendline construction from rise over run
- 1993Disposable chart ratings from confirmed level tests
- 1993When trend channels define fair value after dislocations
- 1993Valid trendline anchors for three-part reversals
- 1994Pairing stochastic divergence with trendline invalidation
- 1995Constructing measured targets after trendline breaks
- 1997A three-part pullback plan with RSI, Fibonacci retracements, and a tight trendline
- 1998Rule-based Trendline construction for testable entries
- 2000Constructing trendlines, breaks, and role reversal
- 2000Constructing speed resistance lines from trend extremes
- 2000Nasdaq tech cycle stages with a 15-day average and trendlines
- 2002Two-session candlesticks that test support, resistance, and trendlines
- 2002Constructing Fibonacci ratio grids from a peak and a trough
- 2002Evaluate trendline geometry before trusting a breakout
- 2002Trendline, volume, and breakout hypotheses versus cycle-end stories
- 2003Writing the long S&P 500 trendline and cycle junction as one hypothesis
- 2003A three-event trendline reversal checklist
- 2003Reverse-engineered Relative Strength Index price curves
- 2003Two-anchor trendline construction without cut-through
- 2004Treat a 15-minute e-mini stair-step as congestion under a daily lid
- 2005A 50-day average, a trendline break, and an open barrier flip
- 2005Matching a forty-day average to a crude trendline
- 2006Constructing a relative spread-strength oscillator for staged cycle confirmation
- 2006Constructing a log-change probability line for trend and range rules
- 2007Linked cross breaks as dollar-pair filters
- 2007A case study in support, resistance, and trendline role reversal on currency charts
- 2007Reading trendline breaks in a housing-sector case
- 2007Constructing replaceable trendlines for break signals
- 2007Reading trendline breaks before the mechanical signal
- 2007Trading choppy forex trends with channels and Fibonacci breaks
- 2007A stacked hypothesis from wave, trendline, ratio, and candle
- 2008Exit rules before entry: trendline, support, and stops
- 2008Capitulation headlines need trend confirmation
- 2008RSI divergence classes, ratio thresholds, and trendline tests
- 2010Support and resistance as falsifiable chart hypotheses
- 2012Reading a 2012 software directory as a breakout and channel case study
- 2013Treat a currency position as a regime, then map shared levels
- 2014Evaluating trendline swing size per market
- 2018Intermarket regime stress and the January 2018 trendline break
- 2018Weekly and daily Stochastic oscillator construction on a single daily chart
- 2018Constructing trendlines, support, and breakout targets from crowd exits
- 2019Trendline break and Fibonacci retracement as a falsifiable outlook check
- 2019Monthly S&P 500 false-break versus the decade trendline