1995issue C081-11
A supermarket-chain case for yield, trendline, and a written checklist
A supermarket-chain case applied a six-item quality screen and two yield maps before any chart work, then treated a multi-year downtrend-line break with volume confirmation as a testable reversal. A written pre-trade checklist used a pullback hold for entry and swing structure, not later headlines, to decide whether to stay.
- The opportunity set was fixed before the chart: a six-item quality screen, then a relative-dividend-yield filter, then a charted shift from a downtrend to an uptrend.
- A second map used the company's own historical-yield-extreme levels to label undervalued, rising-trend, overvalued, or declining-trend states, which is a different test from yield versus the market.
- The reversal became testable only after price broke a multi-year downtrend line with volume confirmation. The actual entry waited for a pullback hold above a specified swing low.
- After entry, a light-volume slip and a later headline selloff were judged against written next steps and intact swing structure, not treated as automatic failure.
A documented supermarket-chain workflow
The documented selection procedure is a two-stage screen. First it isolates names whose dividend yield is high versus a broad-market yield. Then it keeps only those that also show a charted shift from a downtrend to an uptrend.
Before any yield labeling, a six-item quality screen is applied so that only established dividend-paying companies enter the maps. The supermarket-chain case then records the prices, volume, and written next steps that followed once a name had passed those filters.
A quality screen, then two yield maps
The quality screen required five dividend increases in twelve years, an A quality ranking, at least five million shares outstanding, at least eighty institutional holders, twenty-five years of uninterrupted dividends, and earnings improvement in at least seven of the last twelve years. Only after those rules were met did yield labeling begin.
Relative dividend yield is the first cheapness test: the company's dividend yield compared with a broad-market index yield, not with that company's own past. A second value map then uses the historical yield extreme, the company's own past high and low dividend-yield levels, to assign the stock to undervalued, rising-trend, overvalued, or declining-trend states. That second map is a different test from comparing the yield with the market index.
In the supermarket-chain case, the historical undervalue marker was a dividend yield above 3 percent. That marker was reached when price traded below 8 against an annual dividend of 0.24 a share.
Bruno's 3% buy line and 0.8% sell line, 1982–1994
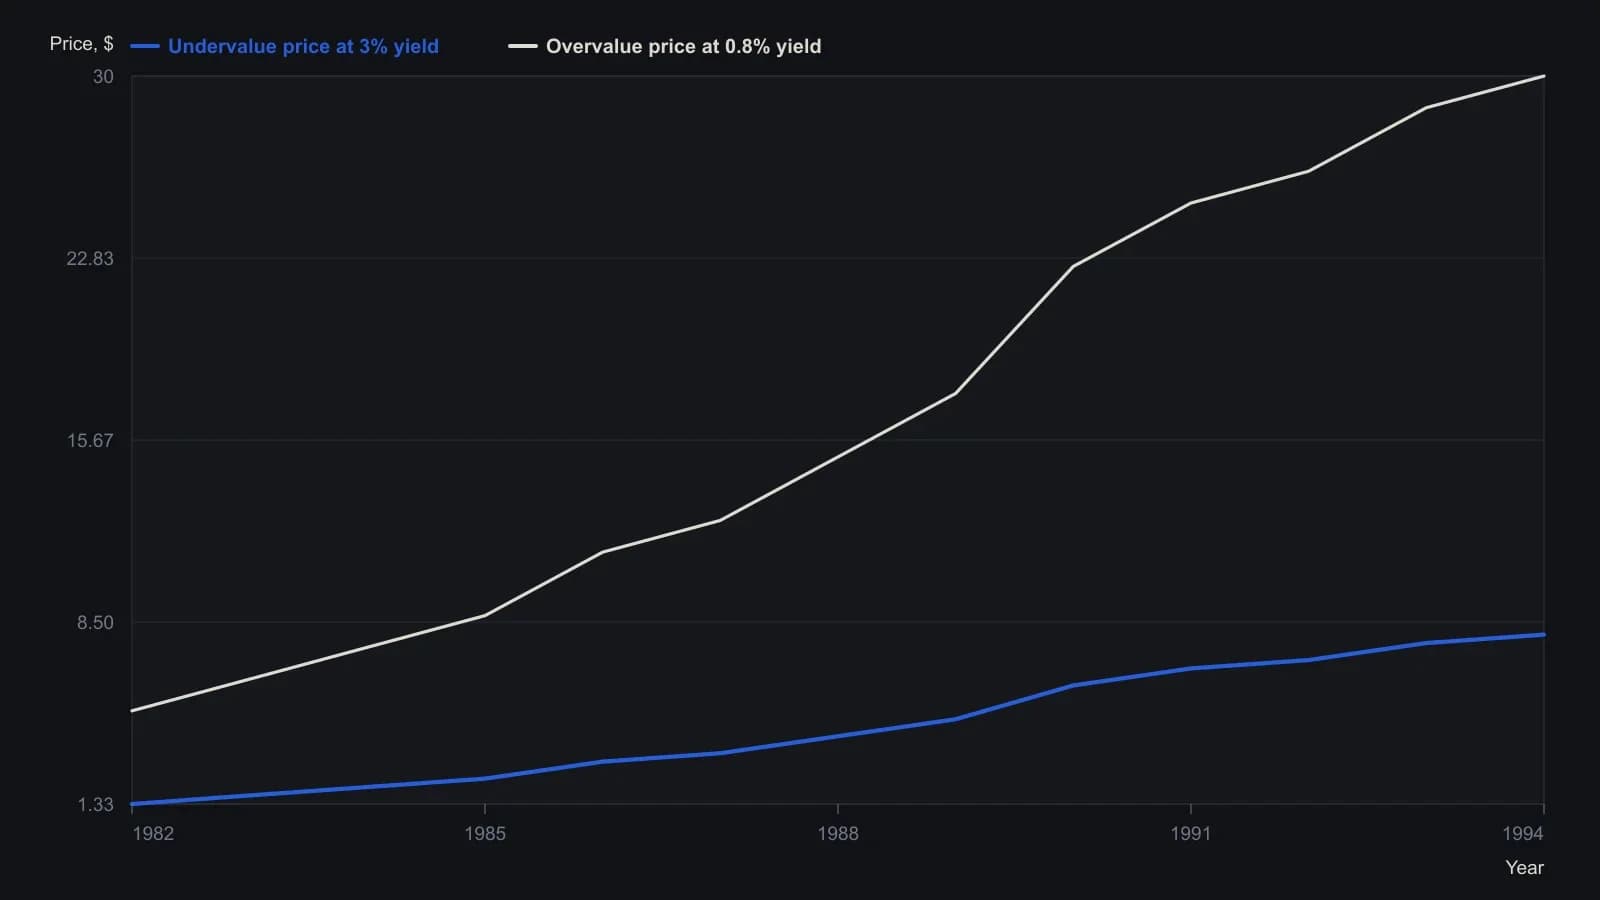
The source panel states that prices within 10% of these historic high-yield or low-yield levels count as undervalued or overvalued. Three 2-for-1 splits are marked on that panel in 1983, 1985 and 1987; the printed dividend row is already on the post-split scale. Intra-year steps on the original plot follow dividend changes inside the calendar year.
A downtrend-line break with volume confirmation
The chart hypothesis required a break of a multi-year downtrend line from the 1991 peak after a sequence of lower highs and lower lows. A downtrend line is a descending line along those lower highs. It remains the invalidation level until price moves through it. The break arrived in September 1994 as price rallied from a July low below 7 through the line to 10 3/8.
Typical volume of 100,000 to 300,000 shares a day expanded with the reversal, including one session above one million shares. That volume confirmation was treated as supporting evidence that larger participants might be recognizing a reversal, and that the decline might be ending. It was not treated as a standalone buy signal.
Pullback hold, written patience, and swing structure
The entry rule waited for a pullback hold rather than buying the break itself. Price had to decline from 10 3/8 and remain above the early-October low of 8 1/8. A purchase was recorded at 8 7/8 on 15 November 1994.
A later slide below 8 1/8 was not treated as an automatic failure because volume was very light and the move could have been year-end tax selling. The written next step was to wait for post-year-end price action.
After a February 1995 high of 10 1/2 and a range near 9 to 9 1/2, a mid-May review extension dropped the stock 1 5/8 to 10 1/2. The selloff held above the March low near 9, and higher highs and higher lows remained intact. The procedure called for staying rather than exiting on the headline. After entry, that sequence is the swing structure used to judge whether a later dip still fits the trend hypothesis.
An editorial reading of the three gates
In editorial terms, the archive workflow can be taught as three gates. Gate one is the quality screen plus the two yield maps, which define the opportunity set before any trade is considered. Gate two is the downtrend-line break with volume confirmation, which turns the reversal into a falsifiable chart hypothesis. Gate three is the pre-trade checklist: an ordered pass or fail procedure that binds value context, chart structure, and execution constraints before the trade is opened, held, or abandoned.
The editorial point of the supermarket-chain case is the order. Cheapness and quality do not generate the entry. The trendline break does not generate the entry. The pullback hold does. Later news is not a new decision. It is checked against the written next step and against intact swing structure.
All readings on this track · 16 readings
- 1988A two-rule classroom book of cheapness and new highs
- 1995A supermarket-chain case for yield, trendline, and a written checklist
- 1996Annual normalized-yield rank rotation for cyclical sleeves
- 1996Value filter then rank-rotate as one procedure
- 1997Dow high-yield rank rotation as a testable portfolio procedure
- 1998Low relative P/E plus a trendline reversal for regime-aware stock selection
- 1998Rank rotation, value screens, and ten-stock diversification
- 2001Earnback period ranking for growth-adjusted screens
- 2003Stress-testing calendar yield rotation in a declining tape
- 2003A value overlay and strangle hedge during a growth-led regime
- 2005Unfashionable value versus momentum in the book
- 2007Why premove fundamentals rarely flag tenfold-price moves
- 2012Year-end yield rank rotation with a collapse veto
- 2015A five-name January book from yield and price ranks
- 2017Screening value traps with regime-aware overlays
- 2017A pre-trade fail test for the cheap-looking name