2002issue C101-3
Evaluate trendline geometry before trusting a breakout
A close through a drawn slope is only as informative as the line behind it. How the slope is anchored, how often and how far apart price meets it, how long it has lasted, and how steep it appears on a fixed chart scale all change how much weight that close-beyond event deserves.
- An external trendline sits on successive minor highs or minor lows and does not cut through the price path, so a later close through it is a warning of possible trend change, not proof the trend has flipped.
- Internal trendlines, including those that ignore one-session spikes, are crossed too often to serve as change warnings and were excluded from the historical sample.
- In that bull-market window, a close below an advancing line was followed by a continued decline 38 percent of the time, while a close above a declining line was followed by a continued advance 69 percent of the time.
- Later measured swings were larger when touches were more widely spaced than the sample medians, when the line was longer than the sample medians, and, with chart aspect held fixed, when the slope sat in a shallower band.
Score the slope before the close
A close through a drawn slope can look like a finished decision. The archive workflow read a later close through the line as a warning of possible trend change, not as proof that the trend had already flipped.
Editorial reading: treat the drawn slope as a testable hypothesis first. How the line is anchored, how often and how far apart price meets it, how long it has lasted, and how steep it appears on a fixed chart scale all change how much weight that close-beyond event deserves.
Draw the line on the outside of the path
Declining slopes are anchored on successive minor highs. Advancing slopes are anchored on successive minor lows. That construction is an external trendline: a slope anchored on successive distinct minor highs or minor lows without cutting through the body of the price path. A later close through that line can then be read as a warning of possible trend change.
Slopes drawn through the interior of the bar path, including those that ignore one-session spikes, are crossed too often to serve as change warnings. That construction is an internal trendline, and the evaluation excluded those interior lines.
Match the chart scale to the working method
A semilog scale, logarithmic price with linear time, was preferred when large vertical moves would compress earlier structure on an arithmetic scale. The chart scale should match the analyst's working method.
Apparent steepness depends on chart aspect ratio. With aspect held fixed, slope was better judged in coarse shallow, neutral, and steep bands than in exact degrees.
How the sample defined a line and a breakout
The evaluation used 199 advancing and 210 declining lines on equities from mid-1991 to mid-1996. Interior lines were excluded. A close-beyond breakout, a session close on the far side of the slope, was required as the breakout and was the event that started the measured subsequent swing. That later swing was taken to the ultimate swing extreme: the farthest high or low after the close-beyond event before a reversal of at least 20 percent.
A trendline touch was a distinct minor high or low that met or approached the slope. The breakout point was not counted as a touch, and only lines with at least three such touches were used. Touch spacing is the average time between counted touches, compared around a sample median near a month of sessions.
What followed the close in that bull-market window
In that bull-market window, a close below an advancing line was followed by a continued decline 38 percent of the time, while a close above a declining line was followed by a continued advance 69 percent of the time. A pierce was treated as a warning that still needed confirming tools.
Which line traits lined up with larger later swings
After a close through the line, subsequent measured swings were larger when touches were more widely spaced than the sample medians of 28 days on advancing lines and 29 days on declining lines, and when line length from first touch to breakout exceeded the sample medians of 137 and 139 days.
Grouping by touch count left advancing lines with only a small difference in the later decline, 16 percent at four or fewer touches versus 18 percent above four. Declining lines with more than four touches showed a larger later advance, 48 percent, than those with four or fewer, 35 percent.
With chart aspect held fixed, shallower lines were associated with larger subsequent swings than steeper ones.
Average rise after a close above a downsloping trendline
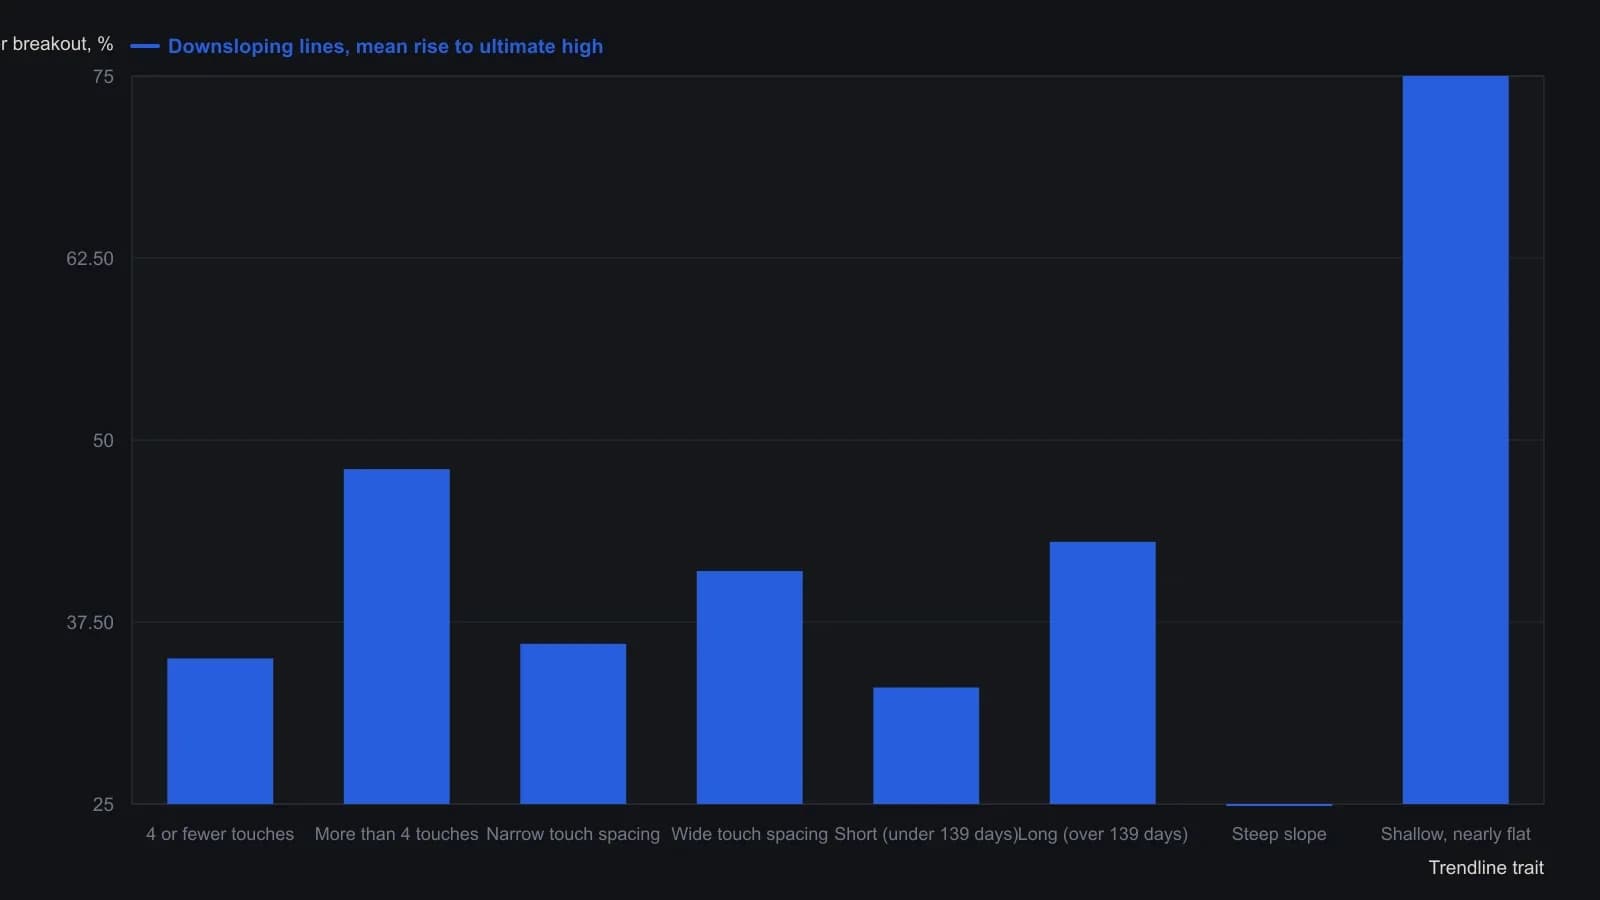
Figures cover 210 external downsloping trendlines; a close beyond the line defined the breakout. Spacing was split at a 29-day median and length at 139 days. The slope contrast is the dozen nearly flat lines versus 16 steeper ones on a fixed chart aspect ratio. The window is a bull market, and the author warned not to treat any single percentage as a forecast.
All readings on this track · 53 readings
- 1984Constructing the slow stochastic from a five-session range
- 1985Gold-proxy trendlines and a January support base
- 1988Construct a five-week new-highs total as a breadth chart
- 1988Stacked channel, trendline, and moving-average warnings in 1987
- 1989Auditing fifth-wave counts with equality, Fibonacci, and trendlines
- 1990Money-fund maturity as a companion Eurodollar chart
- 1990Constructing wave targets from ratios, triangles and trendlines
- 1992Nested time frames for trend and channel signals
- 1992A pre-trade checklist for trendline breaks and loss limits
- 1992Bond-fund timing inside trendlines, retracements, and dual averages
- 1992Two-point trendline construction from rise over run
- 1993Disposable chart ratings from confirmed level tests
- 1993When trend channels define fair value after dislocations
- 1993Valid trendline anchors for three-part reversals
- 1994Pairing stochastic divergence with trendline invalidation
- 1995Constructing measured targets after trendline breaks
- 1997A three-part pullback plan with RSI, Fibonacci retracements, and a tight trendline
- 1998Rule-based Trendline construction for testable entries
- 2000Constructing trendlines, breaks, and role reversal
- 2000Constructing speed resistance lines from trend extremes
- 2000Nasdaq tech cycle stages with a 15-day average and trendlines
- 2002Two-session candlesticks that test support, resistance, and trendlines
- 2002Constructing Fibonacci ratio grids from a peak and a trough
- 2002Evaluate trendline geometry before trusting a breakout
- 2002Trendline, volume, and breakout hypotheses versus cycle-end stories
- 2003Writing the long S&P 500 trendline and cycle junction as one hypothesis
- 2003A three-event trendline reversal checklist
- 2003Reverse-engineered Relative Strength Index price curves
- 2003Two-anchor trendline construction without cut-through
- 2004Treat a 15-minute e-mini stair-step as congestion under a daily lid
- 2005A 50-day average, a trendline break, and an open barrier flip
- 2005Matching a forty-day average to a crude trendline
- 2006Constructing a relative spread-strength oscillator for staged cycle confirmation
- 2006Constructing a log-change probability line for trend and range rules
- 2007Linked cross breaks as dollar-pair filters
- 2007A case study in support, resistance, and trendline role reversal on currency charts
- 2007Reading trendline breaks in a housing-sector case
- 2007Constructing replaceable trendlines for break signals
- 2007Reading trendline breaks before the mechanical signal
- 2007Trading choppy forex trends with channels and Fibonacci breaks
- 2007A stacked hypothesis from wave, trendline, ratio, and candle
- 2008Exit rules before entry: trendline, support, and stops
- 2008Capitulation headlines need trend confirmation
- 2008RSI divergence classes, ratio thresholds, and trendline tests
- 2010Support and resistance as falsifiable chart hypotheses
- 2012Reading a 2012 software directory as a breakout and channel case study
- 2013Treat a currency position as a regime, then map shared levels
- 2014Evaluating trendline swing size per market
- 2018Intermarket regime stress and the January 2018 trendline break
- 2018Weekly and daily Stochastic oscillator construction on a single daily chart
- 2018Constructing trendlines, support, and breakout targets from crowd exits
- 2019Trendline break and Fibonacci retracement as a falsifiable outlook check
- 2019Monthly S&P 500 false-break versus the decade trendline