1997issue C111-6
A three-part pullback plan with RSI, Fibonacci retracements, and a tight trendline
Confirm swing direction with a 14-period relative-strength-index reading relative to 50, mark 38.2%, 50%, and 61.8% fibonacci-retracement levels of a swing between an isolated-high and an isolated-low, then wait for a buy-stop-through-bar or a short countertrend-line break before treating the zone as a live hypothesis.
- Define the swing first: an uptrend is a sequence of higher lows and higher highs, a downtrend is a sequence of lower lows and lower highs, and markets that fail to hold beyond prior extremes are treated as non-trending ranges.
- Use a 14-period relative-strength-index as a momentum-filter: readings above 50 license buy-the-pullback setups, and readings below 50 license sell-the-rally setups.
- Map 38.2%, 50%, and 61.8% fibonacci-retracement levels of the isolated-high to isolated-low range as observation zones, not automatic resting-order prices.
- Treat a retracement as a live hypothesis only after a buy-stop-through-bar fills or a tight trendline along the correction is violated.
The three-part order
The archive workflow is a three-part pullback checklist. First confirm swing direction with a 14-period relative-strength-index reading relative to 50. Next mark 38.2%, 50%, and 61.8% fibonacci-retracement levels of a swing that runs from an isolated-low to an isolated-high, or from an isolated-high to an isolated-low. Then wait for a break of a short countertrend line, or for a stop through the bar that tags the retracement, before treating the level as a live hypothesis.
Until that third step occurs, the retracement prices remain observation zones. They are not automatic resting-order levels.
Trend, range, and when not to measure
An uptrend is defined as a sequence of higher lows and higher highs. A downtrend is defined as a sequence of lower lows and lower highs. Markets that fail to hold beyond prior extremes are treated as non-trending ranges.
A fibonacci-retracement is measured on a labeled swing. A range that cannot hold beyond prior extremes does not supply that swing.
Isolated highs and isolated lows
An isolated-high is a three-bar pattern with a lower high on each neighboring bar. An isolated-low is a three-bar pattern with a higher low on each neighboring bar. Those points mark the start and end of the swing used to measure retracements.
In the terms used here, an isolated-high is also a short-term resistance reference, and an isolated-low is also a short-term support reference.
Fibonacci retracement zones
Consecutive Fibonacci numbers approach a ratio of 1.618 and its inverse 0.618. Alternate terms yield 2.618 and its inverse 0.382. Traders map those ratios onto 38.2%, 50%, and 61.8% retracement levels of a labeled swing.
A fibonacci-retracement is a percentage pullback of that labeled swing, drawn at those three percentages of the isolated-low-to-isolated-high or isolated-high-to-isolated-low range.
The RSI momentum-filter
The relative-strength-index used in this plan is a 14-period momentum oscillator of closes. A reading above 50 is used as a bullish-momentum filter that licenses buy-the-pullback setups. A reading below 50 is used as a bearish-momentum filter that licenses sell-the-rally setups.
That split is the momentum-filter. The RSI side of 50 decides whether a retracement is treated as a buy-the-dip or sell-the-rally setup, rather than as a standalone price level.
Two Treasury-bond measurement cases
In the June 1997 Treasury-bond example, an isolated-low at 106-30 and an isolated-high at 110-10 produced a 38.2% retracement near 109-03. Four days later the contract opened at 108-31 and then advanced to new highs.
In the March 1997 Treasury-bond example, an isolated-high at 116-17 and an isolated-low at 112-22 produced a 50% retracement at 114-19, after which the contract made new lows within three days.
Two entry triggers after a retracement is tagged
Retracement prices are treated as observation zones, not automatic resting-order levels. One entry rule is a buy-stop-through-bar: a buy stop above the high of the bar that first trades into 38.2%, 50%, or 61.8%, with a protective stop under that same bar's low.
A second entry rule is to draw a tight trendline along the highs of a bull-market correction or the lows of a bear-market rally, and to enter only when that line is violated after a fibonacci-retracement has been reached. A close or trade through that line is the trigger.
A combined long on the June 30 case
In the June 30 example, green RSI-positive bars, a 61.8% retracement of three isolated-lows, and a next-day rally that both exceeded the prior high and broke a downtrend line were presented as a combined long signal that preceded a new high.
Sep-97 T-bonds climb through the mid-June Fibonacci grid
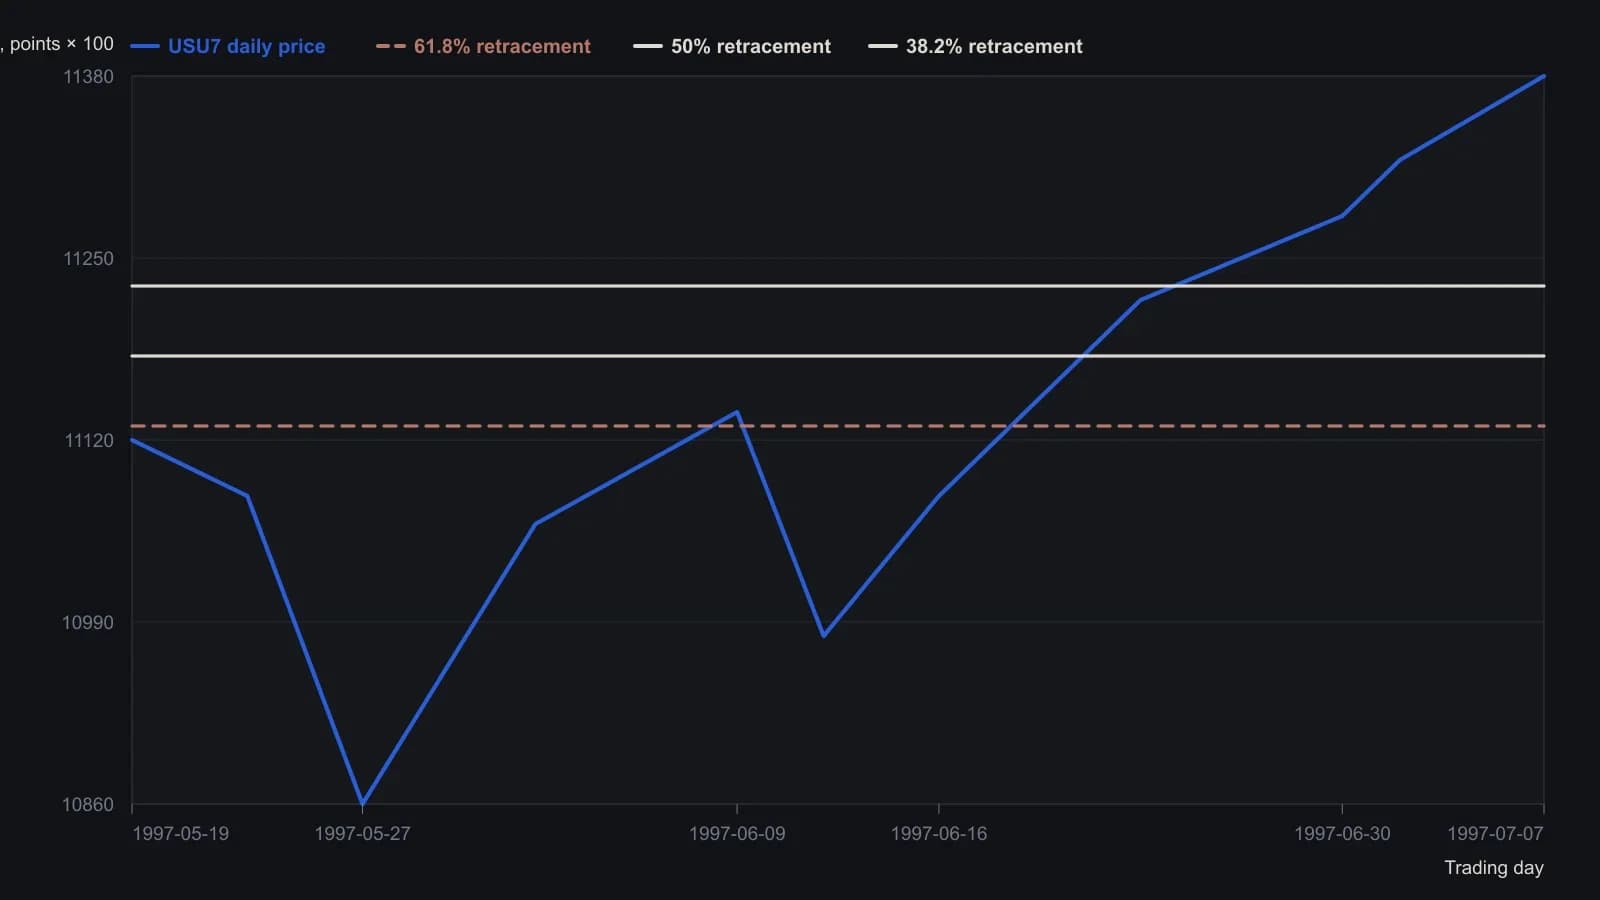
CQG FiboR on USU7 daily, with 0 percent at the early-July high and 100 percent at the mid-June isolated low. Prices digitized to the nearest 20 on the points×100 scale. The 14-period RSI in the lower pane is omitted because it uses a different unit.
All readings on this track · 53 readings
- 1984Constructing the slow stochastic from a five-session range
- 1985Gold-proxy trendlines and a January support base
- 1988Construct a five-week new-highs total as a breadth chart
- 1988Stacked channel, trendline, and moving-average warnings in 1987
- 1989Auditing fifth-wave counts with equality, Fibonacci, and trendlines
- 1990Money-fund maturity as a companion Eurodollar chart
- 1990Constructing wave targets from ratios, triangles and trendlines
- 1992Nested time frames for trend and channel signals
- 1992A pre-trade checklist for trendline breaks and loss limits
- 1992Bond-fund timing inside trendlines, retracements, and dual averages
- 1992Two-point trendline construction from rise over run
- 1993Disposable chart ratings from confirmed level tests
- 1993When trend channels define fair value after dislocations
- 1993Valid trendline anchors for three-part reversals
- 1994Pairing stochastic divergence with trendline invalidation
- 1995Constructing measured targets after trendline breaks
- 1997A three-part pullback plan with RSI, Fibonacci retracements, and a tight trendline
- 1998Rule-based Trendline construction for testable entries
- 2000Constructing trendlines, breaks, and role reversal
- 2000Constructing speed resistance lines from trend extremes
- 2000Nasdaq tech cycle stages with a 15-day average and trendlines
- 2002Two-session candlesticks that test support, resistance, and trendlines
- 2002Constructing Fibonacci ratio grids from a peak and a trough
- 2002Evaluate trendline geometry before trusting a breakout
- 2002Trendline, volume, and breakout hypotheses versus cycle-end stories
- 2003Writing the long S&P 500 trendline and cycle junction as one hypothesis
- 2003A three-event trendline reversal checklist
- 2003Reverse-engineered Relative Strength Index price curves
- 2003Two-anchor trendline construction without cut-through
- 2004Treat a 15-minute e-mini stair-step as congestion under a daily lid
- 2005A 50-day average, a trendline break, and an open barrier flip
- 2005Matching a forty-day average to a crude trendline
- 2006Constructing a relative spread-strength oscillator for staged cycle confirmation
- 2006Constructing a log-change probability line for trend and range rules
- 2007Linked cross breaks as dollar-pair filters
- 2007A case study in support, resistance, and trendline role reversal on currency charts
- 2007Reading trendline breaks in a housing-sector case
- 2007Constructing replaceable trendlines for break signals
- 2007Reading trendline breaks before the mechanical signal
- 2007Trading choppy forex trends with channels and Fibonacci breaks
- 2007A stacked hypothesis from wave, trendline, ratio, and candle
- 2008Exit rules before entry: trendline, support, and stops
- 2008Capitulation headlines need trend confirmation
- 2008RSI divergence classes, ratio thresholds, and trendline tests
- 2010Support and resistance as falsifiable chart hypotheses
- 2012Reading a 2012 software directory as a breakout and channel case study
- 2013Treat a currency position as a regime, then map shared levels
- 2014Evaluating trendline swing size per market
- 2018Intermarket regime stress and the January 2018 trendline break
- 2018Weekly and daily Stochastic oscillator construction on a single daily chart
- 2018Constructing trendlines, support, and breakout targets from crowd exits
- 2019Trendline break and Fibonacci retracement as a falsifiable outlook check
- 2019Monthly S&P 500 false-break versus the decade trendline