2010issue C0363
Support and resistance as falsifiable chart hypotheses
Chart support and resistance are presented as subjective overlays, not as a formula for where price must react. Fibonacci retracements, trendlines, and market channels then compete as ways to mark structure, but adding enough lines can make a later bounce look planned.
- Support and resistance are presented as subjective, with no simple formula for the size or location of a level.
- A common Fibonacci retracement marks potential support and resistance near 23.6%, 38.2%, 50%, 61.8%, 76.4%, and 100% of a prior price move, most coherently from major peaks and troughs.
- Adding enough geometric lines can make later reactions look planned, because price is likely to meet at least one of them.
- Trendlines and market channels are presented as a simpler alternative for locating key structure than dense geometric overlays.
Subjective support and resistance
Chart measures of support and resistance are presented as subjective, with no simple formula for the size or location of a level. Resistance is defined as the price at which buyers become reluctant to add new longs and short sellers believe they have an edge.
Support is a price area where buying previously absorbed selling. A later test can be stated as a long hypothesis until a clean break invalidates it. Resistance is a price area where selling previously capped an advance, and a later test can be stated as either a fade or a breakout hypothesis.
A price area one participant treats as resistance and a reason to sell can be treated by another as a potential breakout.
Retracements from major peaks and troughs
A common retracement method marks potential support and resistance near 23.6%, 38.2%, 50%, 61.8%, 76.4%, and 100% of a prior price move. Retracement overlays are described as most coherent when drawn from major peaks and troughs.
A continuous monthly S&P futures swing from about 1590 to about 670 is used to illustrate retracements at 893, 1027, 1135, 1244, and 1378, with a full retrace near 1590. Those calculated prices are described as candidate resistance on the way up that can become support if penetrated. That later role change is the support-resistance flip.
S&P futures Fibonacci retracements from the 2007–08 swing
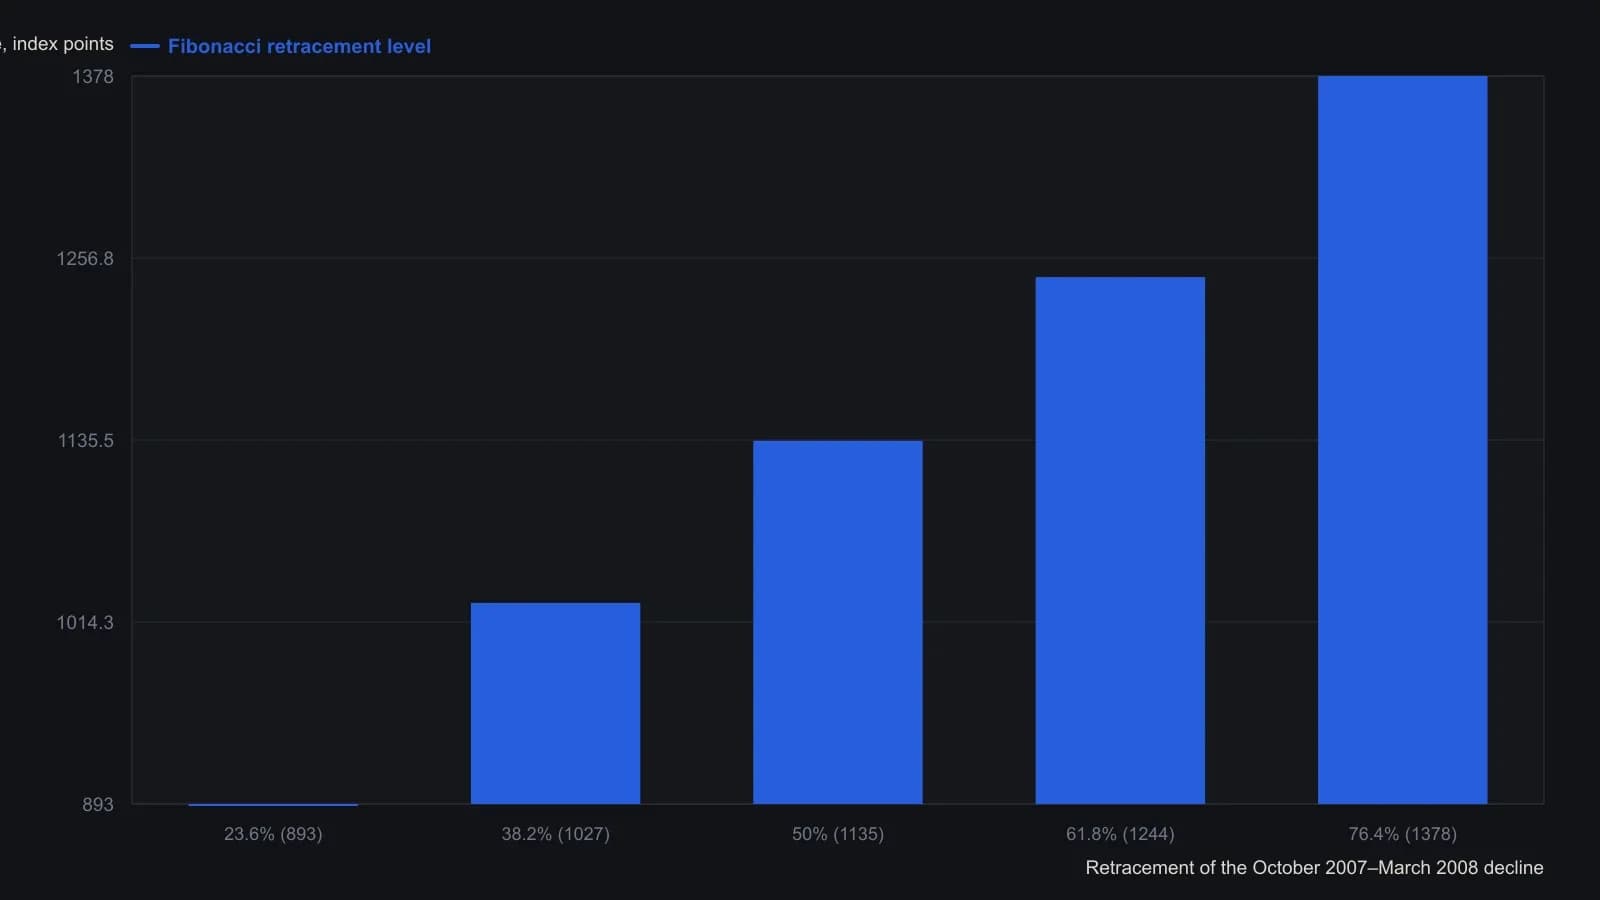
The 100% retrace is the prior high at 1590; the attached image is a column portrait and is not the source of these prices.
Overplotting versus simpler structure
Adding enough geometric lines to a chart can produce the appearance of repeated support-and-resistance reactions because price is likely to meet at least one of them. That is overplotting: so many lines that some later reaction is almost guaranteed, which makes the overlay look accurate after the fact.
Drawing trendlines and market channels is presented as a simpler alternative for locating key structure than dense geometric overlays. A trendline is a straight line joining successive swing highs or lows to describe directional structure and possible reaction zones. A market channel is a pair of roughly parallel trendlines that bound an advance or decline and give both a path and an opposite-side reaction zone.
Mathematical geometry is contrasted with using observed historical market tendencies, on the grounds that a formula cannot predict participant behavior.
All readings on this track · 53 readings
- 1984Constructing the slow stochastic from a five-session range
- 1985Gold-proxy trendlines and a January support base
- 1988Construct a five-week new-highs total as a breadth chart
- 1988Stacked channel, trendline, and moving-average warnings in 1987
- 1989Auditing fifth-wave counts with equality, Fibonacci, and trendlines
- 1990Money-fund maturity as a companion Eurodollar chart
- 1990Constructing wave targets from ratios, triangles and trendlines
- 1992Nested time frames for trend and channel signals
- 1992A pre-trade checklist for trendline breaks and loss limits
- 1992Bond-fund timing inside trendlines, retracements, and dual averages
- 1992Two-point trendline construction from rise over run
- 1993Disposable chart ratings from confirmed level tests
- 1993When trend channels define fair value after dislocations
- 1993Valid trendline anchors for three-part reversals
- 1994Pairing stochastic divergence with trendline invalidation
- 1995Constructing measured targets after trendline breaks
- 1997A three-part pullback plan with RSI, Fibonacci retracements, and a tight trendline
- 1998Rule-based Trendline construction for testable entries
- 2000Constructing trendlines, breaks, and role reversal
- 2000Constructing speed resistance lines from trend extremes
- 2000Nasdaq tech cycle stages with a 15-day average and trendlines
- 2002Two-session candlesticks that test support, resistance, and trendlines
- 2002Constructing Fibonacci ratio grids from a peak and a trough
- 2002Evaluate trendline geometry before trusting a breakout
- 2002Trendline, volume, and breakout hypotheses versus cycle-end stories
- 2003Writing the long S&P 500 trendline and cycle junction as one hypothesis
- 2003A three-event trendline reversal checklist
- 2003Reverse-engineered Relative Strength Index price curves
- 2003Two-anchor trendline construction without cut-through
- 2004Treat a 15-minute e-mini stair-step as congestion under a daily lid
- 2005A 50-day average, a trendline break, and an open barrier flip
- 2005Matching a forty-day average to a crude trendline
- 2006Constructing a relative spread-strength oscillator for staged cycle confirmation
- 2006Constructing a log-change probability line for trend and range rules
- 2007Linked cross breaks as dollar-pair filters
- 2007A case study in support, resistance, and trendline role reversal on currency charts
- 2007Reading trendline breaks in a housing-sector case
- 2007Constructing replaceable trendlines for break signals
- 2007Reading trendline breaks before the mechanical signal
- 2007Trading choppy forex trends with channels and Fibonacci breaks
- 2007A stacked hypothesis from wave, trendline, ratio, and candle
- 2008Exit rules before entry: trendline, support, and stops
- 2008Capitulation headlines need trend confirmation
- 2008RSI divergence classes, ratio thresholds, and trendline tests
- 2010Support and resistance as falsifiable chart hypotheses
- 2012Reading a 2012 software directory as a breakout and channel case study
- 2013Treat a currency position as a regime, then map shared levels
- 2014Evaluating trendline swing size per market
- 2018Intermarket regime stress and the January 2018 trendline break
- 2018Weekly and daily Stochastic oscillator construction on a single daily chart
- 2018Constructing trendlines, support, and breakout targets from crowd exits
- 2019Trendline break and Fibonacci retracement as a falsifiable outlook check
- 2019Monthly S&P 500 false-break versus the decade trendline