1993issue C071-7
Disposable chart ratings from confirmed level tests
A directional rating stays live only while support, resistance, volume-price action, and trendline tests still match a written if-then plan. Three tape walkthroughs show the habit of dropping the name the moment that plan stops confirming.
- Forecast the move with prepared chart work, then wait for that move to begin before acting, rather than entering because an indicator is hoped to be correct.
- Locate support and resistance, trendlines, breakout or breakdown points, and price-volume profiles, then use those readings to revise the stock rating.
- Write the plan first: a long is a bounce from support with a resistance-based exit and a stop set in advance, and a short looks for a failed rally at resistance and a later break of support.
- Change the rating when support is violated or resistance is broken, unless a price-volume profile overrides the mechanical break, and drop the name when the written plan stops confirming.
Keep the rating only while the plan confirms
Prepared chart analysis is used to forecast a move and wait for that move to begin before acting, rather than entering because an indicator is hoped to be correct.
Editorial: treat the directional rating as a disposable hypothesis. It stays live only while support, resistance, volume-price action, and trendline tests keep matching the written if-then plan. The name is dropped the moment that plan stops confirming.
What the chart is asked to find
Chart work is tasked with locating support and resistance, trendlines, breakout or breakdown points, and positive or negative price-volume profiles, then using those readings to revise a stock rating.
Support and resistance are mapped price zones where a hold, stall, or break can confirm or kill a written directional rating. A trendline is a connecting line of highs or lows used to judge whether an advance or decline is still intact. Volume-price analysis reads whether volume expands or contracts with advances and declines, and is used to accept or override a mechanical break of a level.
Write the long and short if-then plan
A planned long is described as a bounce from support. The planned exit uses resistance and the chance of a breakout. A stop price is set in advance so a failed plan can be closed.
Short-side work uses the same map on names rated down, looking for failed rallies at resistance and later breaks of support.
Change the rating when the map breaks
Ratings are described as changing when short-term or intermediate support is violated or resistance is broken. One illustrated name was stepped from a strong-up label to up, then down, then later to neutral after support held and resistance was cleared.
Price-volume momentum profiles can override a mechanical support or resistance break when deciding whether a rating should change.
Three tape walkthroughs
The archive facts below are historical walkthroughs of the same habit: keep the written rating only while the next confirmed test still matches the plan.
General Motors
In the General Motors walkthrough, an up rating stayed in force while a pullback held support near 32. Intermediate resistance near 34-35 was judged unlikely to clear without a stronger price-volume profile.
Editorial: the up name survived because the support test still matched the written plan, not because the rating had to be kept. The ceiling stayed in force until a stronger price-volume profile appeared.
Xerox
In the Xerox walkthrough, support near 77 held, resistance near 80 was tested with high momentum, and a later break through 80 was treated as the planned continuation signal.
Editorial: the continuation claim was allowed only after the hold, the high-momentum test of resistance, and the later break all matched the written plan.
IBM
In the IBM walkthrough, a break below support near 94-95 produced a down rating. Later sessions showed heavier volume on declines and lighter volume on failed retests of broken support. A later first break above a long downtrend line accompanied a shift to a neutral rating with a possible 46-54 range.
Editorial: the down name was dropped when the trendline break and the volume-price profile no longer confirmed the decline as the live plan.
Editorial reading of the three tapes
Editorial: these walkthroughs are not a ranking of names and they do not establish a standing forecast. They are practice in writing an if-then plan, watching the next confirmed test of support, resistance, volume-price action, and the trendline, and discarding the rating as soon as the map stops matching.
IBM daily close with broken downtrend after failed resistance tests
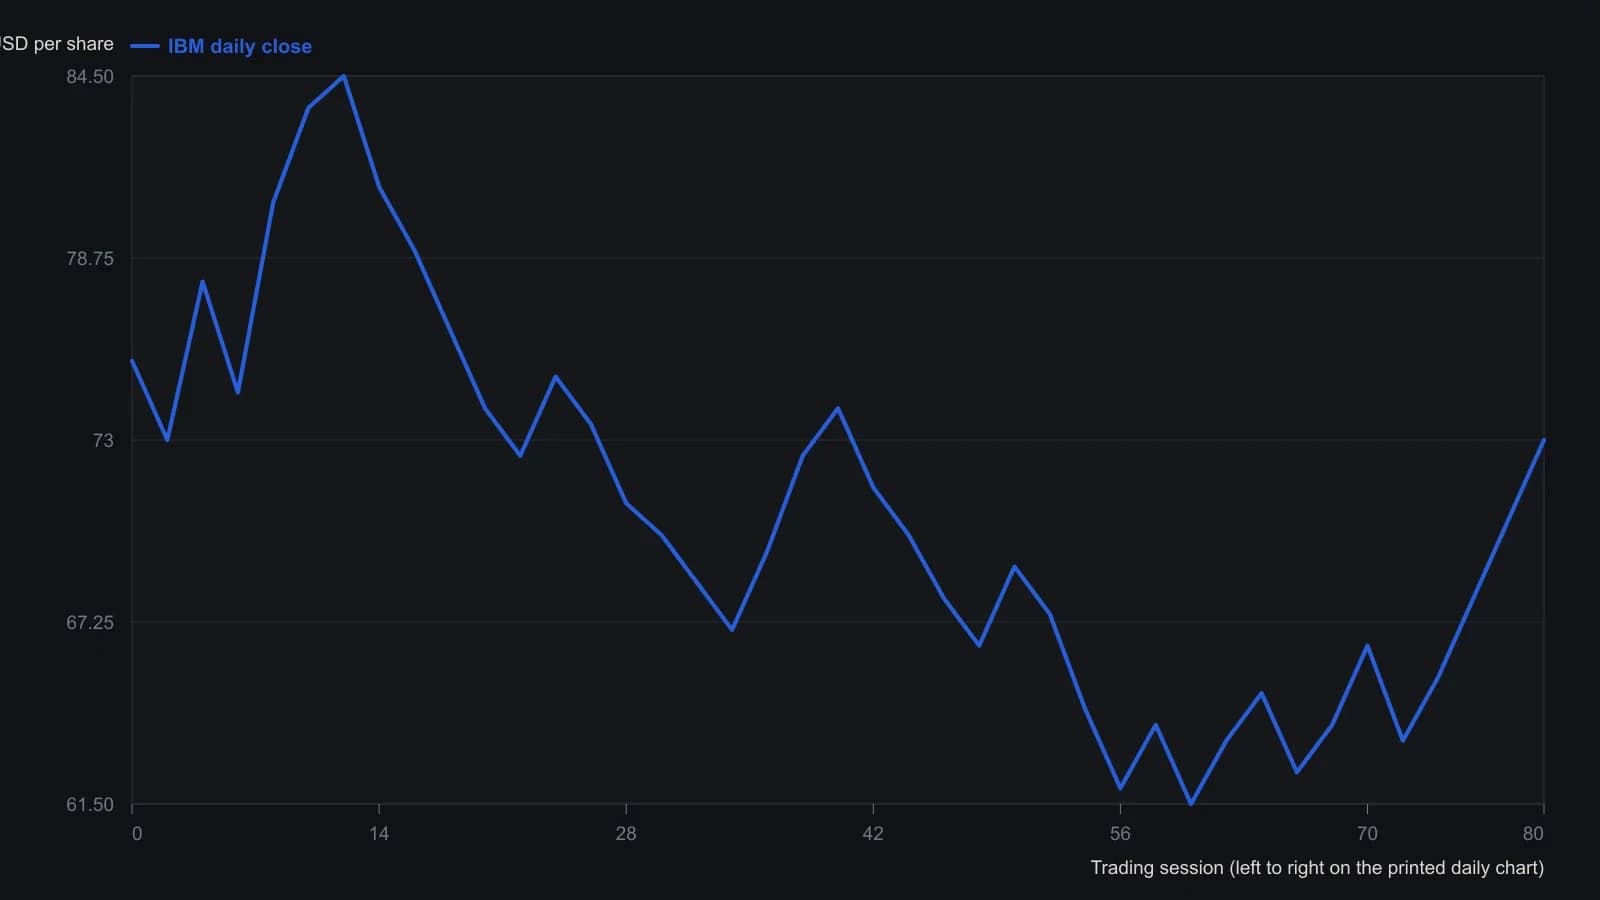
Closes digitized from the lower pane of the printed daily chart; volume pane was not converted. Prices are approximate to the labeled two-dollar grid.
All readings on this track · 53 readings
- 1984Constructing the slow stochastic from a five-session range
- 1985Gold-proxy trendlines and a January support base
- 1988Construct a five-week new-highs total as a breadth chart
- 1988Stacked channel, trendline, and moving-average warnings in 1987
- 1989Auditing fifth-wave counts with equality, Fibonacci, and trendlines
- 1990Money-fund maturity as a companion Eurodollar chart
- 1990Constructing wave targets from ratios, triangles and trendlines
- 1992Nested time frames for trend and channel signals
- 1992A pre-trade checklist for trendline breaks and loss limits
- 1992Bond-fund timing inside trendlines, retracements, and dual averages
- 1992Two-point trendline construction from rise over run
- 1993Disposable chart ratings from confirmed level tests
- 1993When trend channels define fair value after dislocations
- 1993Valid trendline anchors for three-part reversals
- 1994Pairing stochastic divergence with trendline invalidation
- 1995Constructing measured targets after trendline breaks
- 1997A three-part pullback plan with RSI, Fibonacci retracements, and a tight trendline
- 1998Rule-based Trendline construction for testable entries
- 2000Constructing trendlines, breaks, and role reversal
- 2000Constructing speed resistance lines from trend extremes
- 2000Nasdaq tech cycle stages with a 15-day average and trendlines
- 2002Two-session candlesticks that test support, resistance, and trendlines
- 2002Constructing Fibonacci ratio grids from a peak and a trough
- 2002Evaluate trendline geometry before trusting a breakout
- 2002Trendline, volume, and breakout hypotheses versus cycle-end stories
- 2003Writing the long S&P 500 trendline and cycle junction as one hypothesis
- 2003A three-event trendline reversal checklist
- 2003Reverse-engineered Relative Strength Index price curves
- 2003Two-anchor trendline construction without cut-through
- 2004Treat a 15-minute e-mini stair-step as congestion under a daily lid
- 2005A 50-day average, a trendline break, and an open barrier flip
- 2005Matching a forty-day average to a crude trendline
- 2006Constructing a relative spread-strength oscillator for staged cycle confirmation
- 2006Constructing a log-change probability line for trend and range rules
- 2007Linked cross breaks as dollar-pair filters
- 2007A case study in support, resistance, and trendline role reversal on currency charts
- 2007Reading trendline breaks in a housing-sector case
- 2007Constructing replaceable trendlines for break signals
- 2007Reading trendline breaks before the mechanical signal
- 2007Trading choppy forex trends with channels and Fibonacci breaks
- 2007A stacked hypothesis from wave, trendline, ratio, and candle
- 2008Exit rules before entry: trendline, support, and stops
- 2008Capitulation headlines need trend confirmation
- 2008RSI divergence classes, ratio thresholds, and trendline tests
- 2010Support and resistance as falsifiable chart hypotheses
- 2012Reading a 2012 software directory as a breakout and channel case study
- 2013Treat a currency position as a regime, then map shared levels
- 2014Evaluating trendline swing size per market
- 2018Intermarket regime stress and the January 2018 trendline break
- 2018Weekly and daily Stochastic oscillator construction on a single daily chart
- 2018Constructing trendlines, support, and breakout targets from crowd exits
- 2019Trendline break and Fibonacci retracement as a falsifiable outlook check
- 2019Monthly S&P 500 false-break versus the decade trendline