2007issue C081-5
Reading trendline breaks in a housing-sector case
A 2007 housing-sector case shows how a rising weekly trendline on a builders composite can look like recovery while remaining a hypothesis that later price structure may reject.
- A rising weekly trendline on a builders composite can look like the end of an industry decline while remaining a hypothesis that later price can reject.
- The same index had already broken a mid-2000 uptrend and a head-and-shoulders neckline before the mid-July 2006 rally line was drawn.
- The mid-2006 advance was later read as a bear-market rally after its shape, declining average volume, and a later trendline break.
- On the same weekly chart, earnings overlays kept deteriorating while the trendline rose, so the price line and the fundamental overlay disagreed.
What the rising weekly line could not settle
A weekly composite of 24 residential and commercial builders showed a rising trendline from mid-July 2006. Some observers treated that line as evidence the industry decline had ended.
TradersWeek editorial view: the same rising line is better read as a falsifiable hypothesis on a weekly OHLC chart. Later price structure can still reject the recovery reading.
Weekly builders composite and the 2006–07 rising line
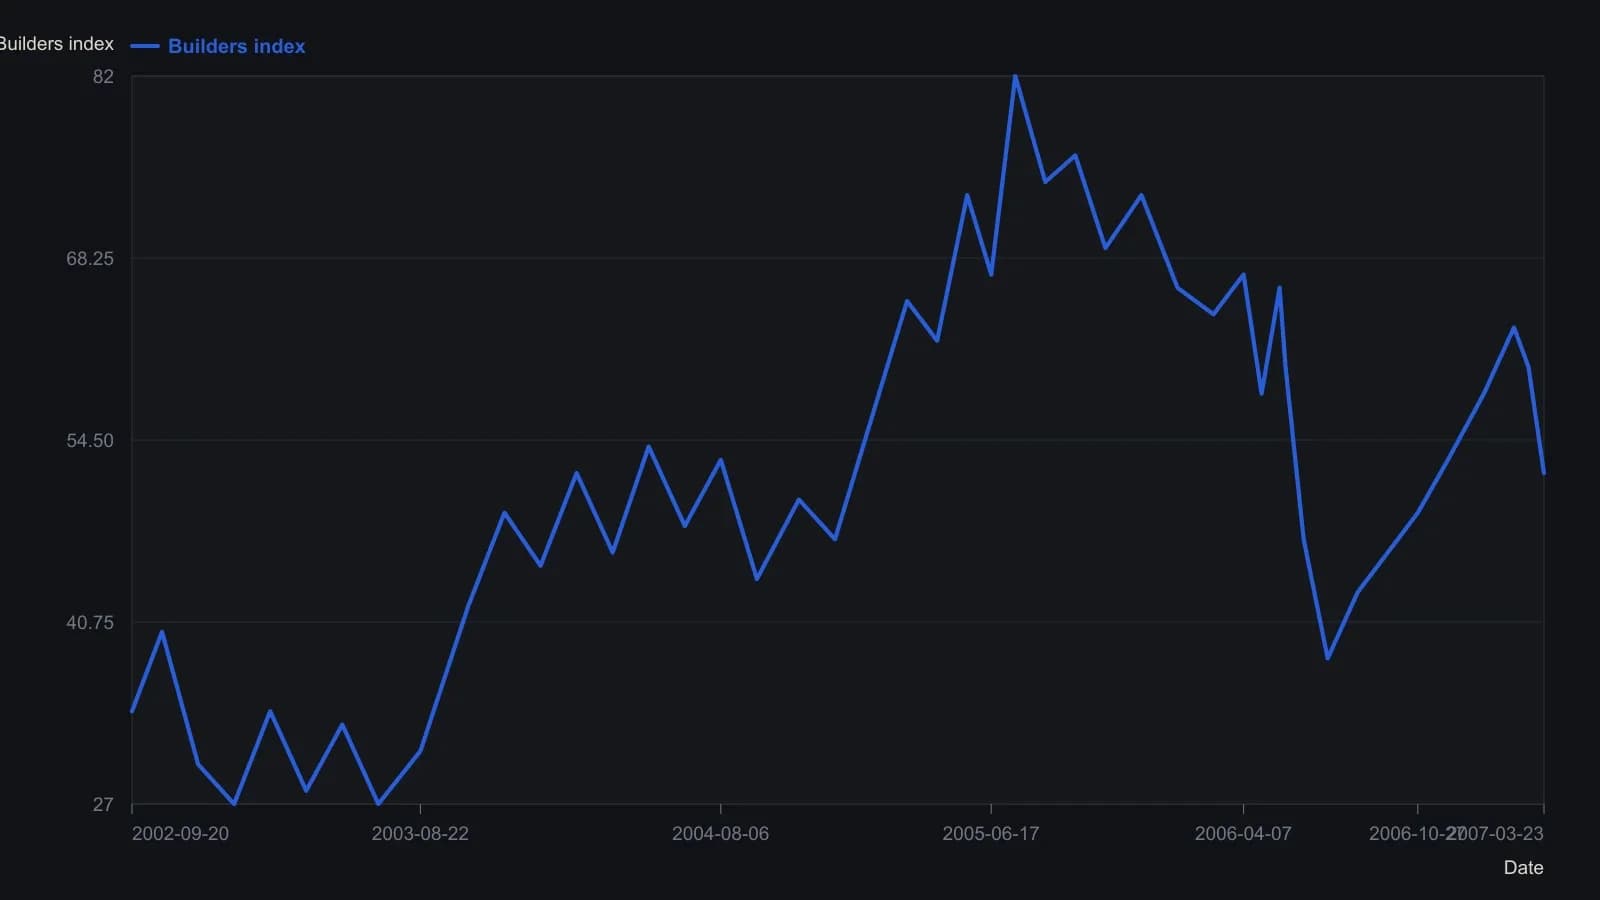
Weekly OHLC bars were digitized from the VectorVest builders-index figure; dates follow the printed axis and the article’s dated breaks (28 Apr 2006, mid-July 2006 rally, 5 Mar 2007). Levels are approximate to a few index points. The lower-pane earnings overlays use a different scale and are omitted.
Breaks that came before the mid-July rally line
The builders index had already lost a long-term uptrend that began in mid-2000, with a decisive breach dated April 28, 2006. A head-and-shoulders neckline break followed in the third week of May 2006.
That neckline is the horizontal or gently sloped support line of a multi-year head-and-shoulders price structure. It is used here only as context around the same weekly chart that also hosts the trendline signals. Trendline breaks on the builders-index weekly chart also marked early 2006.
The mid-2006 advance as a later bear-market rally
The mid-July 2006 rally line was later shown as breached on March 5. That same mid-2006 advance was later read as a bear-market rally because its shape resembled a bearish flag or rising wedge and average volume declined while the pattern formed.
A bear-market rally is a multi-week advance inside a larger decline. It can resemble a new uptrend until the advance itself is invalidated by a later trendline break.
A rising line and a deteriorating overlay
During the July 2006 to February 2007 builders-index rally, earnings-growth, earnings-per-share, and growth-to-price-earnings lines on the same weekly chart continued to deteriorate. The rising trendline and the fundamental overlay disagreed.
Other weekly charts in the same sector tape
A weekly chart of a large homebuilder showed an April 2007 breakdown through a head-and-shoulders neckline after a structure that had been forming since mid-2003. Earnings growth turned negative only after that technical breakdown.
A weekly mortgage-lender chart showed a long-term uptrend line breached on April 2, 2007, the same period another lender formally entered bankruptcy.
Home prices as the wider backdrop
National home-price history from 1987 through the fourth quarter of 2006 was presented as a parabolic rise in which prices doubled between 1999 and 2006. That history supplied the broader price-structure backdrop for the later sector trendline tests.
All readings on this track · 53 readings
- 1984Constructing the slow stochastic from a five-session range
- 1985Gold-proxy trendlines and a January support base
- 1988Construct a five-week new-highs total as a breadth chart
- 1988Stacked channel, trendline, and moving-average warnings in 1987
- 1989Auditing fifth-wave counts with equality, Fibonacci, and trendlines
- 1990Money-fund maturity as a companion Eurodollar chart
- 1990Constructing wave targets from ratios, triangles and trendlines
- 1992Nested time frames for trend and channel signals
- 1992A pre-trade checklist for trendline breaks and loss limits
- 1992Bond-fund timing inside trendlines, retracements, and dual averages
- 1992Two-point trendline construction from rise over run
- 1993Disposable chart ratings from confirmed level tests
- 1993When trend channels define fair value after dislocations
- 1993Valid trendline anchors for three-part reversals
- 1994Pairing stochastic divergence with trendline invalidation
- 1995Constructing measured targets after trendline breaks
- 1997A three-part pullback plan with RSI, Fibonacci retracements, and a tight trendline
- 1998Rule-based Trendline construction for testable entries
- 2000Constructing trendlines, breaks, and role reversal
- 2000Constructing speed resistance lines from trend extremes
- 2000Nasdaq tech cycle stages with a 15-day average and trendlines
- 2002Two-session candlesticks that test support, resistance, and trendlines
- 2002Constructing Fibonacci ratio grids from a peak and a trough
- 2002Evaluate trendline geometry before trusting a breakout
- 2002Trendline, volume, and breakout hypotheses versus cycle-end stories
- 2003Writing the long S&P 500 trendline and cycle junction as one hypothesis
- 2003A three-event trendline reversal checklist
- 2003Reverse-engineered Relative Strength Index price curves
- 2003Two-anchor trendline construction without cut-through
- 2004Treat a 15-minute e-mini stair-step as congestion under a daily lid
- 2005A 50-day average, a trendline break, and an open barrier flip
- 2005Matching a forty-day average to a crude trendline
- 2006Constructing a relative spread-strength oscillator for staged cycle confirmation
- 2006Constructing a log-change probability line for trend and range rules
- 2007Linked cross breaks as dollar-pair filters
- 2007A case study in support, resistance, and trendline role reversal on currency charts
- 2007Reading trendline breaks in a housing-sector case
- 2007Constructing replaceable trendlines for break signals
- 2007Reading trendline breaks before the mechanical signal
- 2007Trading choppy forex trends with channels and Fibonacci breaks
- 2007A stacked hypothesis from wave, trendline, ratio, and candle
- 2008Exit rules before entry: trendline, support, and stops
- 2008Capitulation headlines need trend confirmation
- 2008RSI divergence classes, ratio thresholds, and trendline tests
- 2010Support and resistance as falsifiable chart hypotheses
- 2012Reading a 2012 software directory as a breakout and channel case study
- 2013Treat a currency position as a regime, then map shared levels
- 2014Evaluating trendline swing size per market
- 2018Intermarket regime stress and the January 2018 trendline break
- 2018Weekly and daily Stochastic oscillator construction on a single daily chart
- 2018Constructing trendlines, support, and breakout targets from crowd exits
- 2019Trendline break and Fibonacci retracement as a falsifiable outlook check
- 2019Monthly S&P 500 false-break versus the decade trendline