1993issue C041-6
Two-speed oscillators with divergence and trendline gates
A fast oscillator only raises a turn hypothesis. A slower sibling must print divergence or a zero-line flip, and a price trendline is the abstention gate, so momentum, divergence, and structure are tested as one procedure.
- A fast oscillator raises a turn hypothesis only. Its overlay cross is an alert, not an entry or exit.
- Call a top or bottom only after the smoothed sibling prints divergence or a zero-line cross.
- Read a sideways plateau on the slower line during a small countertrend pause as the larger trend still intact.
- Keep a price trendline as the last gate so an oscillator warning is not a standalone trade.
One procedure, three checks
An oscillator is the plotted difference between two series: close versus an average, close versus a close a fixed number of bars earlier, or one average versus another. It is used to mark momentum shifts, temporary extremes inside a trend, and possible trend changes.
The archive workflow binds those readings to a slower confirmation and a price-structure check. The fast line may propose a turn. A slower sibling must then print divergence or a zero-line flip. A price trendline is the abstention gate so the three checks are tested as one procedure.
Price excess and the smoothed sibling
Price excess is constructed as the close minus a longer simple average, or as a short-versus-long simple price oscillator, with a shorter average overlaid so a cross of that overlay is treated as the turn signal.
The smoothed price-excess variant subtracts a longer simple average from a shorter exponential average of the close and again overlays a shorter average. The figures present that variant as less jagged and with fewer extra crossings.
Offset momentum
Offset momentum is built by subtracting a lagged moving-average value from the current one. A shorter overlay is used to mark direction changes.
Any offset is to be kept as short as still fits the chart and style. A shorter average with a very short offset is given as an alternative, while a longer average with a wider offset plus a short overlay is offered for intermediate swings.
Fast alert, slow confirmation
Overlaying the short offset-momentum line on its smoothed counterpart treats their cross as an early alert. A later divergence on the smoothed line, or a smoothed-line zero-line cross, is then required before calling a top or bottom.
In the illustrated equity example, price continued higher after offset momentum peaked, so a later zero-line cross is treated as the check that avoids acting on the earlier divergence alone.
Sideways plateaus on the smoothed offset-momentum line during small countertrend pauses are read as the larger trend still being intact rather than as a reversal.
Dual histograms and the trendline gate
Drawing both smoothed oscillators as histograms is used to emphasize polarity around zero and to make divergences easier to see, including a stretch where price kept rising while the smoothed offset-momentum line diverged.
Oscillators are described as better matched to range conditions. In trends they can print divergences that prompt early exits or entries. The prescribed countermeasure is a confirming price trendline, illustrated when that line broke as the smoothed offset-momentum reading fell through zero.
Eastman Kodak: fast vs smoothed offset momentum
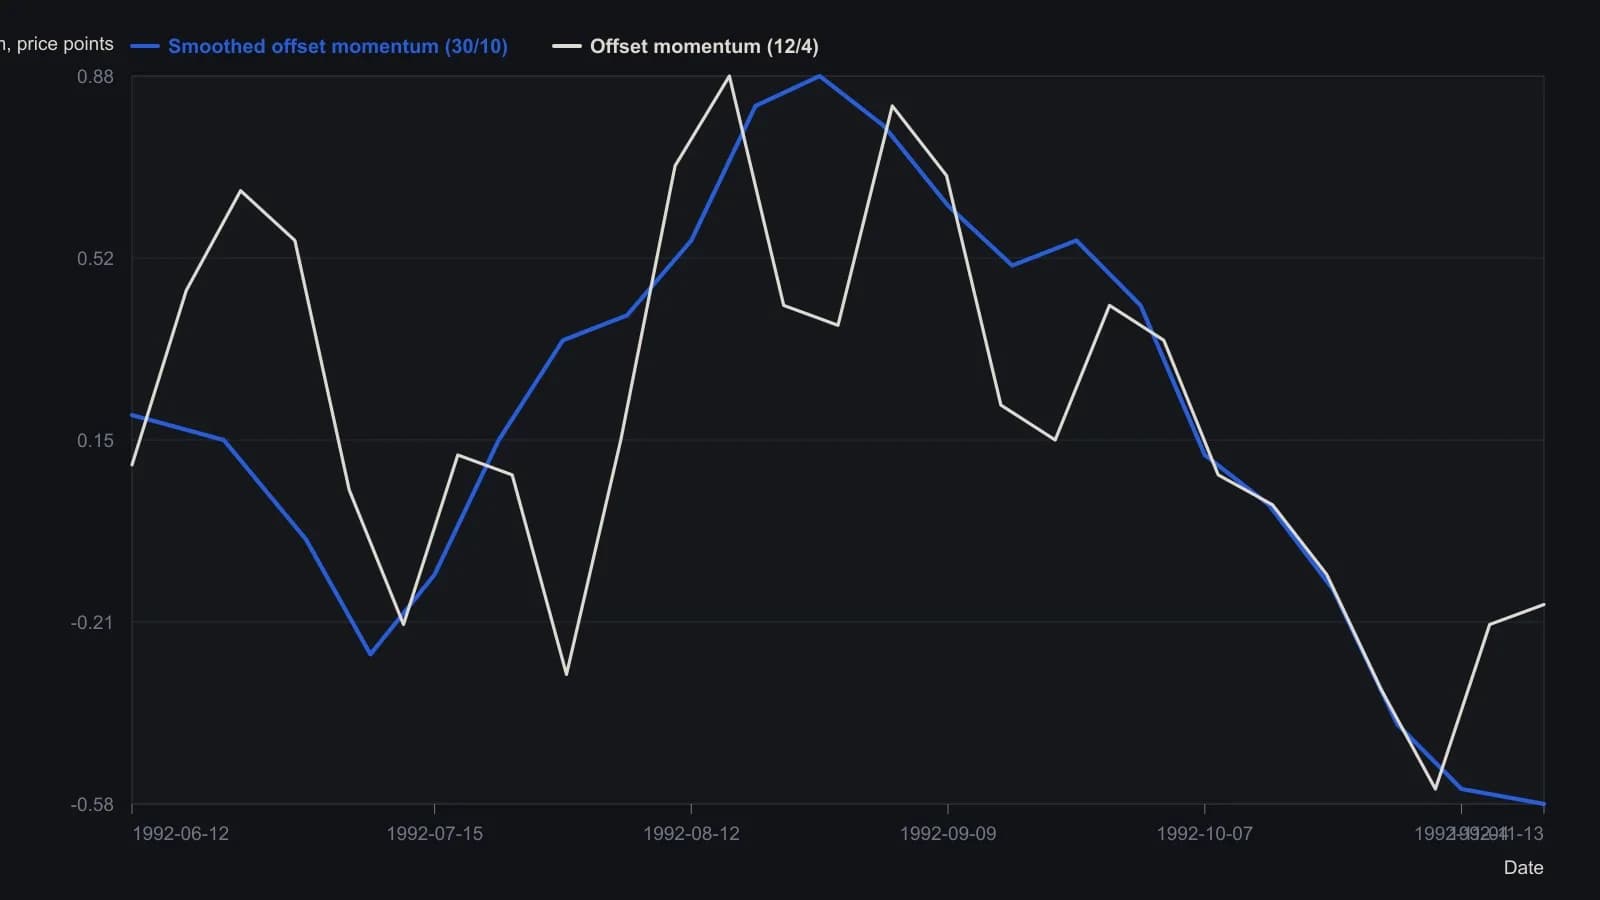
Fast series is a 12-day simple average less its value four days earlier; the slow series is a 30-day average with a 10-day offset, each with a six-day average overlaid in the source. Y readings are approximate from the printed scale.
All readings on this track · 51 readings
- 1984Half-cycle differencing for momentum signals
- 1987Relative strength evaluation under competing optimization criteria
- 1988Weekly MACD as a two-clock momentum confirmation stack
- 1989Equal-weight zero-cross from smoothed spreads
- 1989Testing relative-strength-index reversal rules against trend continuation
- 1989Smoothed three-day futures filter for index option bounces
- 1989Cycle-length windows for momentum, Relative Strength Index, and stochastic construction
- 1991Filtered rally magnitude as a bull-regime breakout
- 1992Constructing true strength from double-smoothed momentum
- 1992Constructing a double-smoothed true strength index
- 1993When momentum structure and breadth break together
- 1993Constructing double-smoothed range and momentum oscillators
- 1993Constructing a two-parameter relative momentum index
- 1993Building a bounded momentum oscillator with RSI smoothing
- 1993Two-speed oscillators with divergence and trendline gates
- 1993Constructing a relative momentum index from the relative strength index
- 1994Constructing daily advance-decline breadth tools
- 1994Building a composite regime score from monetary climate and weekly trend
- 1994Averaging Relative Strength Index and the stochastic oscillator into one reversal oscillator
- 1995Dividend-yield regression as a hold versus momentum gate
- 1996Jump and hold filters for long-term Treasury yield direction
- 1997Constructing extendedness from a 10 percent swing filter
- 1997A range-expansion oscillator that can refuse its own stretch
- 1997RSI trend permission and Fibonacci pullback rules
- 1998Nested midpoint construction for a range-normalized oscillator
- 1999Evaluating Relative Strength Index momentum with zero-line and threshold rules
- 1999Treat RSI and momentum as three mechanical procedures
- 2000Thrust strength figure from moving-average swings
- 2001Constructing a non-range-bound balance of market power score
- 2004Cleaned breadth oscillator and new-high divergence: a swing-market case file
- 2004Evaluating advance-issues-momentum on a fixed-symbol-basket
- 2004Constructing a trend filter from two adjacent high-low windows
- 2006A dollar-versus-commodity extreme as a regime case
- 2008Zero-centered stochastic bands and bracket stops
- 2012Evaluating engulfing momentum across hold windows
- 2012Staged stops as one mechanical entry and exit procedure
- 2012Stacking a relative-strength-index forecast, a trend filter, and long-only momentum
- 2013Constructing fair-value filters from averages and momentum
- 2014Constructing a multi-window slope divergence entry
- 2015Bandedge trend filter construction with inverse crossover rules
- 2017Opposite rules for index price and volatility momentum
- 2018A three-state overlay that colors a trend only after the line clears the bar
- 2018Half-cycle relative-strength index with a Fisher map for cyclic reversals
- 2018Emotion as a rule input when momentum breaks
- 2018Two-bar body expansion as a momentum breakout construction
- 2019Pair a two-day high breakout with a volume-weighted exit on the same chart
- 2020Building reflex and trendflex cross and extreme entry rules
- 2020Construct a dual-series price momentum oscillator overlay
- 2020A multi-timeframe stochastic as a panel of weekly voters
- 2020Centerline crossovers that compare index momentums
- 2020Multi-timeframe stochastic voting as one mechanical rule