1992issue C021-3
Grade closing tick before a next-session breadth hypothesis
Closing tick nets issues that finished on an uptick against those that finished on a downtick. The archive workflow used that close to judge whether buyers or sellers were favored, then asked how extreme the net print had to be before a next-session index lean was more than mild.
- Closing tick is the number of issues whose final print was an uptick minus the number whose final print was a downtick, and it is used to judge whether the close favored buyers or sellers.
- A next-session-check compares today's closing-tick reading with the following session's index direction. The historical check did this across 417 New York Stock Exchange sessions.
- A positive closing tick below 700 was only a mild association with a higher following session. A reading above 300 was described as the start of a mildly probable next-day advance, and a reading above 700 was treated as stronger than a merely positive print.
- Negative readings were only mildly associated with a lower following session until they fell below -450, which that sample treated as a strong next-session downside association.
What closing tick counts
Closing tick is the number of issues whose final print was an uptick minus the number whose final print was a downtick. An uptick is a last trade printed above the immediately prior trade, and a downtick is a last trade printed below the immediately prior trade.
The reading is published each day for more than one market and is used to judge whether the close favored buyers or sellers.
A participation reading at the close
As market-breadth, closing tick is a participation reading based on how many issues finish on an uptick versus a downtick rather than on a single index print. The first job of the reading is simply to say which side finished the session with more last prints in its favor.
The next-session-check
The historical check covered 417 New York Stock Exchange sessions and asked whether that day's closing tick lined up with the following day's index move.
A next-session-check compares today's closing-tick reading with the following session's index direction to test whether the breadth print is informative. The archive workflow did not stop at the sign of the close. It asked how large the net print was before treating the next-session lean as more than mild.
Grading a positive close
A positive closing tick below 700 was treated as only a mild association with a higher following session. A closing tick above 700 was treated as a stronger next-session upside association than a merely positive reading.
On the positive-side chart, a reading above 300 was described as the start of a mildly probable next-day advance.
Next-day S&P 500 average after a positive closing tick
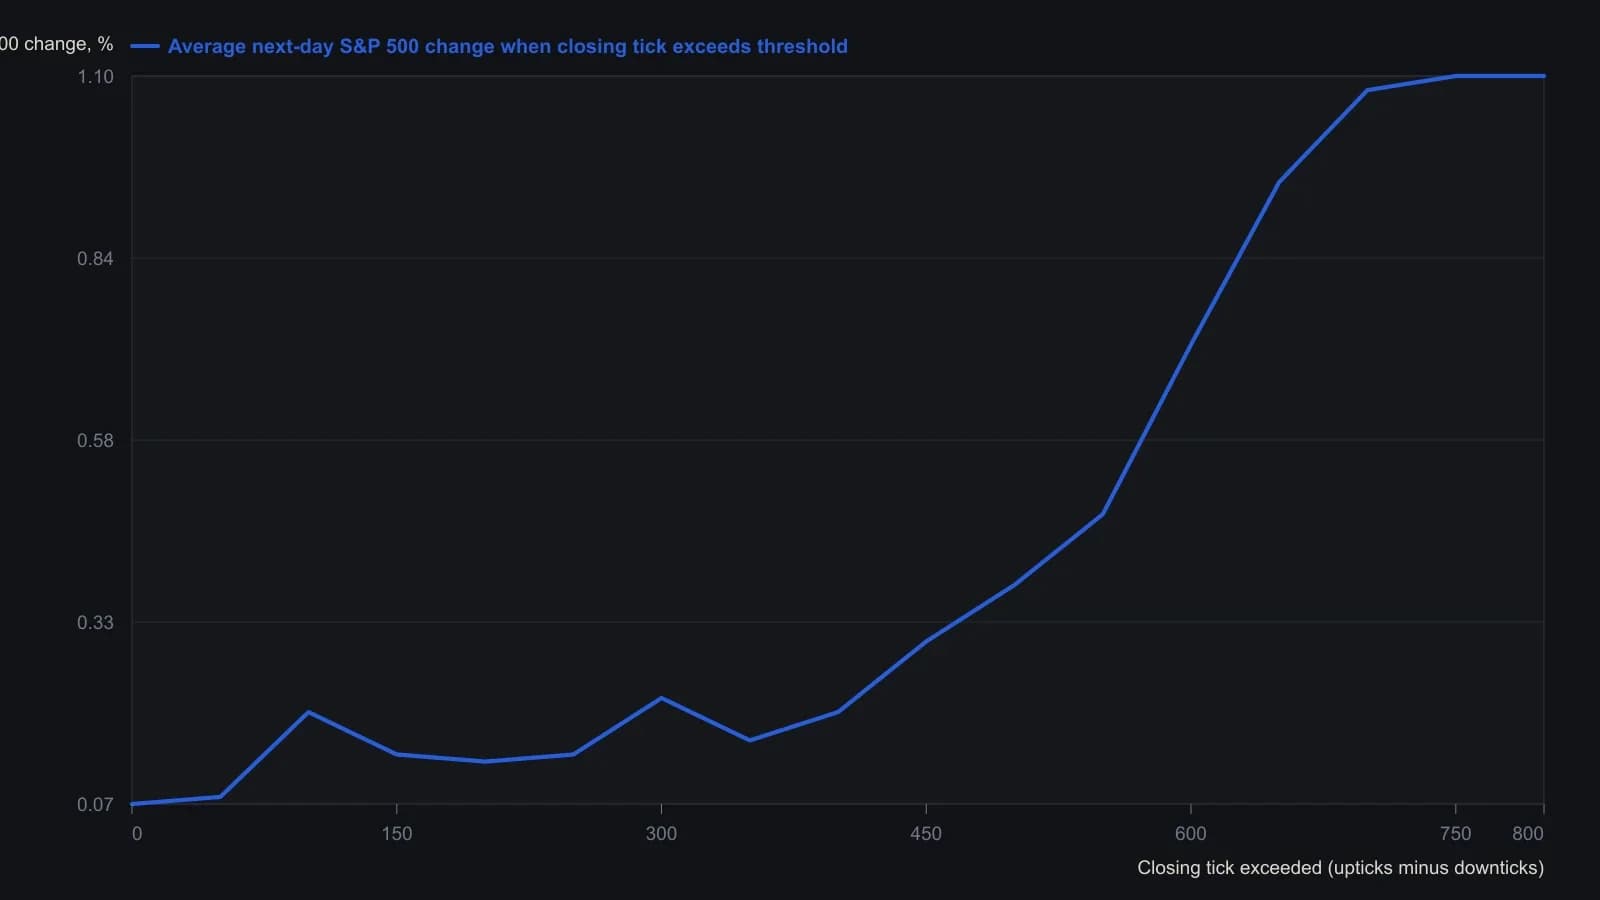
Figure 1 is a threshold plot: each x is a closing-tick floor and y is the mean next-day S&P 500 percent change on days that cleared that floor. Digitized from the printed curve, so y is approximate to about 0.05 percentage points except the +750 point, which the text gives as 1.1 percent.
Grading a negative close
Negative readings were treated as only mildly associated with a lower following session until they fell below -450. A closing tick below -450 was treated as a strong next-session downside association in that sample.
Editorial reading of the grades
Editorial interpretation: the evaluation habit is to keep an ordinary positive or negative close in the mild column. Use the next-session-check to ask whether today's print is still only a lean or has reached the stronger associations used in that sample. The archive facts describe that historical grading. They do not turn closing tick into a stand-alone rule.
All readings on this track · 71 readings
- 1987How a failed rebound, weak breadth, and cycle dates broke the 1987 bull case
- 1988Diagnosing market bottoms with breadth, divergence and averages
- 1988Diagnosing index tops with breadth divergences
- 1988Record highs versus seven-day breadth and divergence
- 1989Constructing a percentage-scaled internals composite
- 1989Constructing a weekly block-tick breadth z-score
- 1989Constructing a dual-rate advance-decline oscillator
- 1989Normalize advance-decline series for a common-scale comparison
- 1990Unchanged-issue share as a narrow-breadth case study
- 1990Evaluating daily and weekly unsigned plurality breadth
- 1990Constructing paired new-high and new-low breadth indicators
- 1990Ten-day HI/LO extremes as a long-horizon breadth signal
- 1990Confirming index cycles with breadth, volume, and waves
- 1990Index cycle gates from breadth and volume
- 1990Constructing advance-decline breadth indicators
- 1990Weekly advance-decline oscillator: weight map, extremes, and spike cycle
- 1990Price-weighted construction distorts breadth, support, and trend
- 1991A peak-sequence test from the new-highs-to-advances-ratio
- 1991Fuzzy rules that turn daily market-breadth into a session consensus
- 1991From daily breadth tallies to a weighted consensus signal
- 1991Retesting market-breadth when market structure changes
- 1991Constructing TRIN as a breadth-volume ratio
- 1991Build the market clock before you read a price bar
- 1991A construction audit of the long-horizon trading index
- 1991Independent formula timers kept as a testable combination
- 1992When identical TRIN prints come from different pairings
- 1992Grade closing tick before a next-session breadth hypothesis
- 1992Noncumulative advance-decline swing confirmation
- 1992Five-day sum construction of the trading index
- 1992Daily closing-trin extremes and next-day direction
- 1992A three-layer audit: regime, breadth, and group RSI
- 1992Constructing a nine-state trend, momentum, and breadth score
- 1993Constructing a market-volume-impact rating from nested averages
- 1993When advance-decline confirmation counts the wrong universe
- 1993Constructing breadth momentum from advance-decline smoothing
- 1993Constructing a cumulative market-thrust line
- 1994Three-horizon construction of the Haurlan index
- 1994Checklist-gated session entry in 1993 index futures
- 1994Read one advance-decline pair through three windows
- 1994Constructing calibrated market-breadth summation indexes
- 1994Constructing a two-speed advance-decline oscillator and a calibrated summation
- 1995NYSE tick extremes and candlestick reversal entries
- 1995Assembling range, breadth, and a stored stop into one procedure
- 1995Restating market breadth timing rules as ratios
- 1995Constructing breadth ratio gates after lookback drawdowns
- 1995Building a short-range breadth and price oscillator
- 1996Constructing a smoothed advance-decline trend filter
- 1996Smoothed advance-decline alerts at the 1987 and 1990 turning points
- 1996Constructing breadth, RSI, and stochastic range filters
- 1996New-high and new-low counts as a breadth construction
- 1996Constructing the four-input breadth-volume ratio
- 1996Constructing the McClellan oscillator and a calibrated summation index
- 1996Declare the oscillator seed, then calibrate only the summation index
- 1997Three-gate centered strength in market-breadth construction
- 1997Daily advance-decline and new-high new-low breadth signals
- 1999Index-fund positions as a majority-vote committee
- 2000Tick, tiki and TRIN as a three-layer session confirmation stack
- 2000Constructing an advance-decline oscillator from one listed tape
- 2001Market breadth, beta, and volume-price confirmation
- 2001Regime context from relative venue volume, breadth, and intermarket spreads
- 2002When NYSE breadth misreads operating-stock participation
- 2003Two-gate breadth divergence and a trend filter for rally tops
- 2003Market internals confirm or diverge from the index
- 2004Constructing the McClellan oscillator and summation index
- 2005Intraday index-futures divergence as a three-part session hypothesis
- 2005Breadth summation levels as a short-term signal filter
- 2005Checking trend versus range with breadth and divergence
- 2011Constructing a Nasdaq hi-lo index from highs, lows, and issues traded
- 2013Cumulative advance-decline versus a one-year average
- 2013A one-year breadth average as a participation gate
- 2015Falsifying a healthy correction with breadth and support