1991issue C041-8
Fuzzy rules that turn daily market-breadth into a session consensus
Daily market-breadth readings can be treated as graded conditions rather than as yes-or-no labels. Those grades are then combined in an explicit decision-tree of production rules so it is clear which breadth facts fired, how strongly they fired, and whether the session consensus is bullish or bearish.
- Technical breadth and valuation readings are treated as partial indications, with membership-function grades between 0 and 1 rather than as strictly true or false facts.
- A knowledge base of if-then rules can be joined as alternatives with the max-operator or as joint conditions with the min-operator, then turned into a session reading.
- A daily-exchange demonstration fuzzifies published session statistics, evaluates twenty weighted production rules, and sums each degree-of-fulfilment into a signed consensus.
- Derived series recast a standard trin ratio so large positive updn values describe rising sessions, while add1es tracks an exponentially smoothed slope of the advance-decline line.
Graded conditions, not yes-or-no labels
Technical breadth and valuation readings are treated as partial indications with membership grades between 0 and 1 rather than as strictly true or false facts. A membership-function maps each crisp market-breadth input onto a mu-value between 0 and 1, describing how well that input belongs to a linguistic category.
Editorial reading: those grades keep the session inspectable. A trader can see which market-breadth facts fired, how strongly they fired, and whether the later consensus is bullish or bearish.
A production-rule decision-tree
A production-rule system is an inference engine plus a knowledge base. The engine tests the left-hand-side of each rule against incoming observations, and only rules whose conditions hold become candidates for execution.
The knowledge base is a decision-tree of if-then rules that can be joined as alternatives or as joint conditions. The max-operator keeps the largest membership grade when rules are joined as alternatives. The min-operator keeps the smallest membership grade when conditions must hold together. The combined left-hand-side membership grade becomes the rule's strength.
Choosing a rule and applying its conclusion
When a rule is chosen by the largest-membership method, the selected right-hand-side is applied in full. The membership grade is used only to choose the rule, not to scale the action.
Rule selection and output construction can follow one of three procedures: keep the single strongest rule, average conclusions scaled by their membership grades, or take the centroid of the scaled membership areas. The selected conclusions are then converted into a session reading.
A daily-exchange demonstration
A worked daily-exchange example fuzzifies published session statistics, evaluates each rule's left-hand-side membership, assigns that grade to the right-hand-side conclusion, then converts the selected conclusions into a session reading.
The demonstration program reads date, new highs, new lows, advances, declines, advancing volume, and declining volume. From those fields it computes a standard Arms-style breadth ratio, the trin, as advancing issues times declining volume divided by declining issues times advancing volume. Values of trin below 1 accompany rising sessions and values above 1 accompany falling sessions.
Derived series, updn, and add1es
Two derived breadth series recast that ratio so large positive values describe rising sessions and large negative values describe falling sessions. The updn statistic is constructed in that signed way: large positive values describe bullish sessions and large negative values describe bearish sessions.
A third series, add1es, is an exponentially smoothed reading of the slope of the advance-decline line. Exponential-smoothing is a recursively updated average that weights the latest observation more heavily than earlier ones. The demonstration uses a 0.4 update constant.
Twenty weighted rules and a session consensus
The knowledge base contains 20 weighted production rules whose signed weights run from +1 to -1. Each fired rule contributes a degree-of-fulfilment equal to membership grade times weight. Those contributions are summed into a session consensus, the signed sum of degrees of fulfilment across all rules that fired, used as a compact bullish-or-bearish reading of the session.
Linguistic grades without a stored table
Inputs are mapped computationally onto linguistic grades such as positive-big through negative-big, then onto compound grades such as any, positive, negative, and not-extreme. The mapping does not rely on a stored membership table.
NYSE advancing versus declining issues, February–July 1990
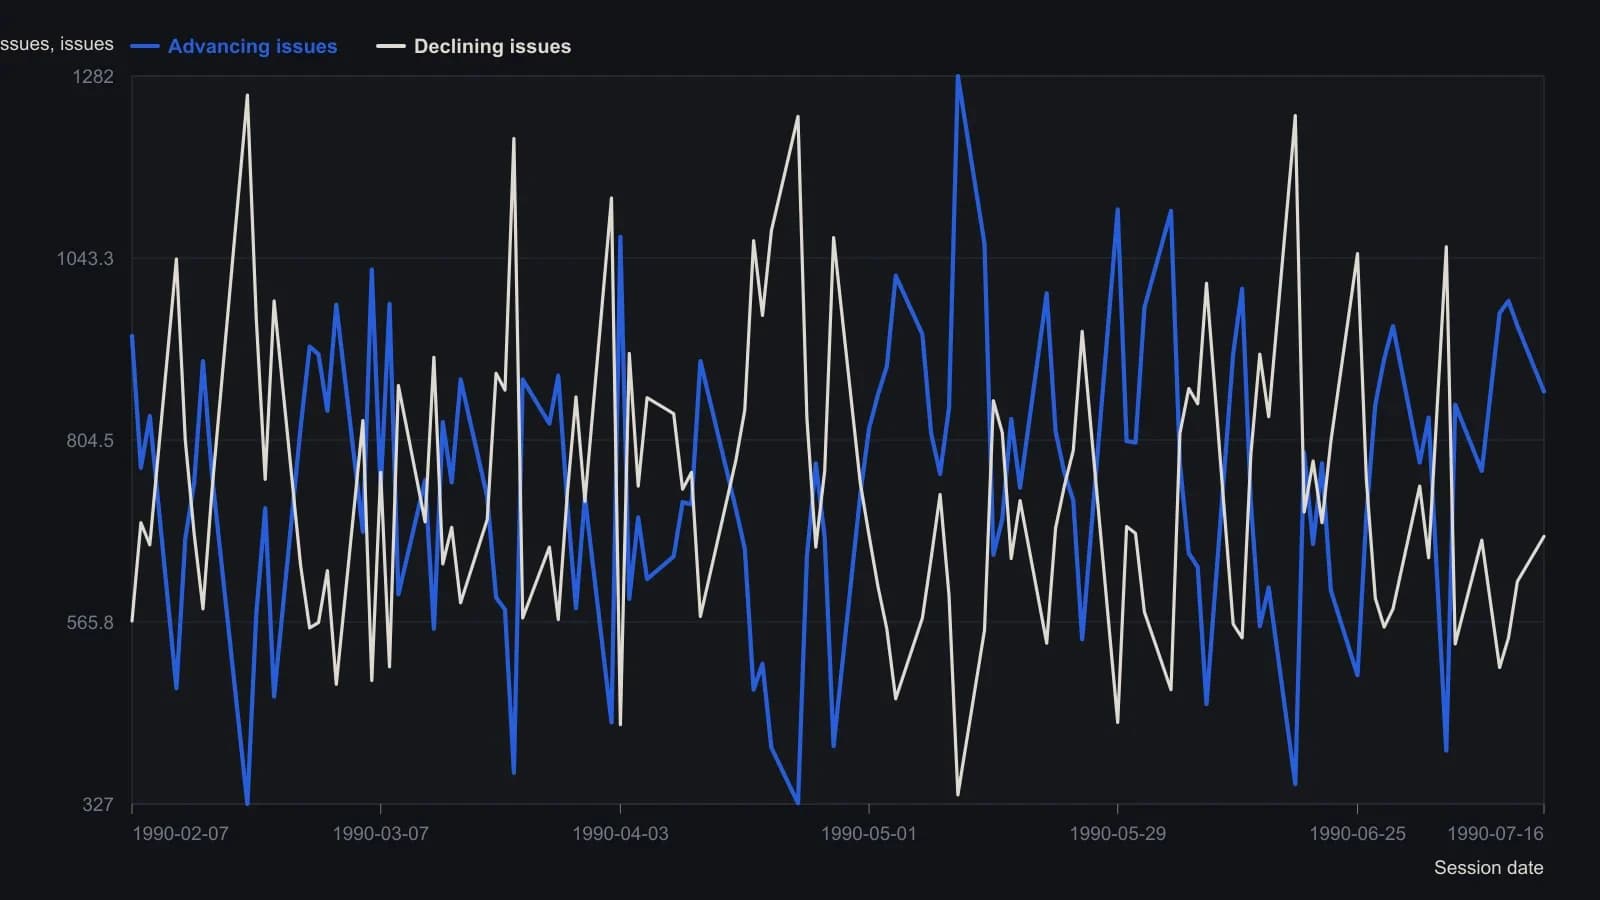
Values are the ADV and DCL columns in the FLDJ DATA listing, 7 February through 16 July 1990. Weekends and the Independence Day holiday are omitted exactly as in the source.
All readings on this track · 71 readings
- 1987How a failed rebound, weak breadth, and cycle dates broke the 1987 bull case
- 1988Diagnosing market bottoms with breadth, divergence and averages
- 1988Diagnosing index tops with breadth divergences
- 1988Record highs versus seven-day breadth and divergence
- 1989Constructing a percentage-scaled internals composite
- 1989Constructing a weekly block-tick breadth z-score
- 1989Constructing a dual-rate advance-decline oscillator
- 1989Normalize advance-decline series for a common-scale comparison
- 1990Unchanged-issue share as a narrow-breadth case study
- 1990Evaluating daily and weekly unsigned plurality breadth
- 1990Constructing paired new-high and new-low breadth indicators
- 1990Ten-day HI/LO extremes as a long-horizon breadth signal
- 1990Confirming index cycles with breadth, volume, and waves
- 1990Index cycle gates from breadth and volume
- 1990Constructing advance-decline breadth indicators
- 1990Weekly advance-decline oscillator: weight map, extremes, and spike cycle
- 1990Price-weighted construction distorts breadth, support, and trend
- 1991A peak-sequence test from the new-highs-to-advances-ratio
- 1991Fuzzy rules that turn daily market-breadth into a session consensus
- 1991From daily breadth tallies to a weighted consensus signal
- 1991Retesting market-breadth when market structure changes
- 1991Constructing TRIN as a breadth-volume ratio
- 1991Build the market clock before you read a price bar
- 1991A construction audit of the long-horizon trading index
- 1991Independent formula timers kept as a testable combination
- 1992When identical TRIN prints come from different pairings
- 1992Grade closing tick before a next-session breadth hypothesis
- 1992Noncumulative advance-decline swing confirmation
- 1992Five-day sum construction of the trading index
- 1992Daily closing-trin extremes and next-day direction
- 1992A three-layer audit: regime, breadth, and group RSI
- 1992Constructing a nine-state trend, momentum, and breadth score
- 1993Constructing a market-volume-impact rating from nested averages
- 1993When advance-decline confirmation counts the wrong universe
- 1993Constructing breadth momentum from advance-decline smoothing
- 1993Constructing a cumulative market-thrust line
- 1994Three-horizon construction of the Haurlan index
- 1994Checklist-gated session entry in 1993 index futures
- 1994Read one advance-decline pair through three windows
- 1994Constructing calibrated market-breadth summation indexes
- 1994Constructing a two-speed advance-decline oscillator and a calibrated summation
- 1995NYSE tick extremes and candlestick reversal entries
- 1995Assembling range, breadth, and a stored stop into one procedure
- 1995Restating market breadth timing rules as ratios
- 1995Constructing breadth ratio gates after lookback drawdowns
- 1995Building a short-range breadth and price oscillator
- 1996Constructing a smoothed advance-decline trend filter
- 1996Smoothed advance-decline alerts at the 1987 and 1990 turning points
- 1996Constructing breadth, RSI, and stochastic range filters
- 1996New-high and new-low counts as a breadth construction
- 1996Constructing the four-input breadth-volume ratio
- 1996Constructing the McClellan oscillator and a calibrated summation index
- 1996Declare the oscillator seed, then calibrate only the summation index
- 1997Three-gate centered strength in market-breadth construction
- 1997Daily advance-decline and new-high new-low breadth signals
- 1999Index-fund positions as a majority-vote committee
- 2000Tick, tiki and TRIN as a three-layer session confirmation stack
- 2000Constructing an advance-decline oscillator from one listed tape
- 2001Market breadth, beta, and volume-price confirmation
- 2001Regime context from relative venue volume, breadth, and intermarket spreads
- 2002When NYSE breadth misreads operating-stock participation
- 2003Two-gate breadth divergence and a trend filter for rally tops
- 2003Market internals confirm or diverge from the index
- 2004Constructing the McClellan oscillator and summation index
- 2005Intraday index-futures divergence as a three-part session hypothesis
- 2005Breadth summation levels as a short-term signal filter
- 2005Checking trend versus range with breadth and divergence
- 2011Constructing a Nasdaq hi-lo index from highs, lows, and issues traded
- 2013Cumulative advance-decline versus a one-year average
- 2013A one-year breadth average as a participation gate
- 2015Falsifying a healthy correction with breadth and support