1994issue C051-8
Checklist-gated session entry in 1993 index futures
A stock-index futures long dated 23 November 1993 is rebuilt as a same-session written procedure. Market-breadth, a positioning split, and intermarket-analysis had to pass before a session trigger could become an order, and the checklist-process is the only object under test.
- Decision confluence treated the 23 November 1993 index-futures long as a same-session decision that could not be placed until monthly, weekly, daily, and intraday conditions agreed.
- Market-breadth extremes, including a 10-day advance-decline average near -230 and an oscillator print of -127, were stated as a hypothesis the next session could accept or reject.
- Intermarket-analysis required bonds and utilities to rise together in the 10:00 to 11:00 a.m. Central hour, plus NASDAQ and mid-cap strength, before instrument and size were chosen.
- The written procedure withheld the long until breadth, positioning, sentiment, and intermarket checks passed, then used an S&P open-rally-setback-new-high sequence as the last necessary filter, not a standalone rule.
A same-session decision, not a recap
The archive frames a stock-index futures long dated 23 November 1993 as a same-session decision. Monthly, weekly, daily, and intraday conditions had to agree before any order was placed.
That binding is decision confluence: every time-scale line had to pass, or the session produced no trade. This piece treats the binding as a checklist-process studio. It does not treat the long as a victory recap.
Calendar bias as an alert, not an order
The window into Thanksgiving 1993 was treated as a seasonal alert. The last two and first five sessions of a month, and the two sessions before a market holiday, were assigned a recurring upward bias.
Editorial reading: a seasonal alert can load the checklist. It cannot replace decision confluence, and it is not permission to place the order.
Market-breadth as a hypothesis
After a 2.5% five-session decline in the S&P, a 10-day average of NYSE advances minus declines reached about -230. That print sat below a -200 zone that had often coincided with the end of 1% to 3% short-term selloffs.
A breadth oscillator consulted only beyond +100 or -100 printed -127 on 21 November. It was read as an oversold extreme only because the tape was still classified as a bull market, not a bear regime.
Editorial reading: market-breadth is a signal built from advance-decline structure and related oscillators. The repeatable oversold condition is a hypothesis that the next session may accept or reject. It is not, by itself, an entry.
10-day NYSE advance-decline average into the November 1993 washout
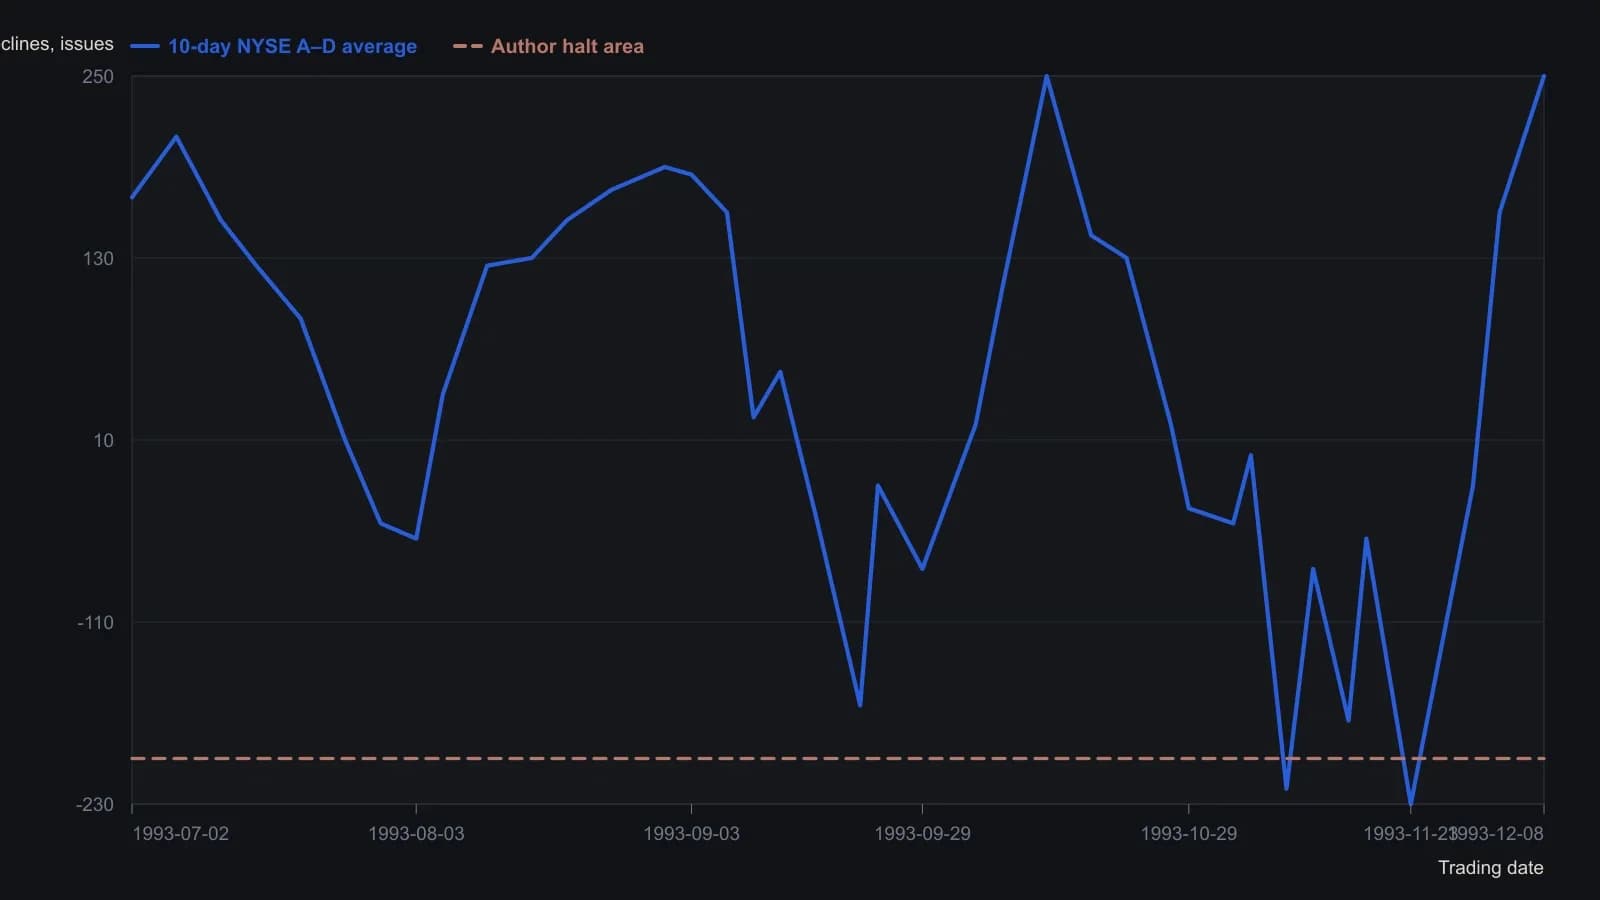
Smith’s rule is that 1–3 percent S&P and Dow pullbacks had been stalling near −200; he calls the November print the worst of 1993. Digitised points are rounded to the nearest five to ten issues and can be off by a session or two on the magazine raster.
Positioning split and sentiment lines
For the nine weeks before that session, commercial accounts in stock-index futures stayed net long while large speculators held a near-record net short. That mix had previously been associated with the October 1990 low.
Editorial reading: the contrast is a positioning split. It is squeeze-risk and regime context, not a standalone forecast.
The latest delayed specialist-versus-public short-sale figures showed the public shorting more than specialists, and at the second-highest ratio of 1993. Index-option volume spent four weeks above 125 puts per 100 calls, then printed a three-to-one two-day put-over-call burst on 19 and 22 November. A weekly advisor poll read 33.0% bullish against 40.9% bearish.
Regime context before the session trigger
The written trigger required utilities and bonds to rise together in the 10:00 to 11:00 a.m. Central hour. It also required NASDAQ and mid-cap strength after a 5.28% six-session NASDAQ drop, and an S&P open-rally-setback-new-high sequence, before a mid-cap futures long that was held overnight and exited the next mid-morning.
Editorial reading: intermarket-analysis is a regime check. It places one index-futures idea against related markets, including bonds, utilities, and leadership among mid-cap, over-the-counter, industrial, and transport averages, before size or instrument is chosen.
The same intraday price pattern was treated as one necessary filter, not a standalone rule. The long was withheld until breadth, positioning, sentiment, and intermarket checks also passed.
Editorial reading: that last price-structure test is the session trigger. Typically an open, rally, setback, and new session high, it converts a prepared checklist into an entry or a pass.
What the procedure leaves untraded
On this tape the hold rule was overnight and the exit was the next mid-morning. If any required line failed, the correct output of the procedure was to stand aside.
Editorial reading: entry, overnight hold, exit, and abstention are not separate habits. They are lines of the same checklist-process, and the process fails closed when any line does not pass.
All readings on this track · 71 readings
- 1987How a failed rebound, weak breadth, and cycle dates broke the 1987 bull case
- 1988Diagnosing market bottoms with breadth, divergence and averages
- 1988Diagnosing index tops with breadth divergences
- 1988Record highs versus seven-day breadth and divergence
- 1989Constructing a percentage-scaled internals composite
- 1989Constructing a weekly block-tick breadth z-score
- 1989Constructing a dual-rate advance-decline oscillator
- 1989Normalize advance-decline series for a common-scale comparison
- 1990Unchanged-issue share as a narrow-breadth case study
- 1990Evaluating daily and weekly unsigned plurality breadth
- 1990Constructing paired new-high and new-low breadth indicators
- 1990Ten-day HI/LO extremes as a long-horizon breadth signal
- 1990Confirming index cycles with breadth, volume, and waves
- 1990Index cycle gates from breadth and volume
- 1990Constructing advance-decline breadth indicators
- 1990Weekly advance-decline oscillator: weight map, extremes, and spike cycle
- 1990Price-weighted construction distorts breadth, support, and trend
- 1991A peak-sequence test from the new-highs-to-advances-ratio
- 1991Fuzzy rules that turn daily market-breadth into a session consensus
- 1991From daily breadth tallies to a weighted consensus signal
- 1991Retesting market-breadth when market structure changes
- 1991Constructing TRIN as a breadth-volume ratio
- 1991Build the market clock before you read a price bar
- 1991A construction audit of the long-horizon trading index
- 1991Independent formula timers kept as a testable combination
- 1992When identical TRIN prints come from different pairings
- 1992Grade closing tick before a next-session breadth hypothesis
- 1992Noncumulative advance-decline swing confirmation
- 1992Five-day sum construction of the trading index
- 1992Daily closing-trin extremes and next-day direction
- 1992A three-layer audit: regime, breadth, and group RSI
- 1992Constructing a nine-state trend, momentum, and breadth score
- 1993Constructing a market-volume-impact rating from nested averages
- 1993When advance-decline confirmation counts the wrong universe
- 1993Constructing breadth momentum from advance-decline smoothing
- 1993Constructing a cumulative market-thrust line
- 1994Three-horizon construction of the Haurlan index
- 1994Checklist-gated session entry in 1993 index futures
- 1994Read one advance-decline pair through three windows
- 1994Constructing calibrated market-breadth summation indexes
- 1994Constructing a two-speed advance-decline oscillator and a calibrated summation
- 1995NYSE tick extremes and candlestick reversal entries
- 1995Assembling range, breadth, and a stored stop into one procedure
- 1995Restating market breadth timing rules as ratios
- 1995Constructing breadth ratio gates after lookback drawdowns
- 1995Building a short-range breadth and price oscillator
- 1996Constructing a smoothed advance-decline trend filter
- 1996Smoothed advance-decline alerts at the 1987 and 1990 turning points
- 1996Constructing breadth, RSI, and stochastic range filters
- 1996New-high and new-low counts as a breadth construction
- 1996Constructing the four-input breadth-volume ratio
- 1996Constructing the McClellan oscillator and a calibrated summation index
- 1996Declare the oscillator seed, then calibrate only the summation index
- 1997Three-gate centered strength in market-breadth construction
- 1997Daily advance-decline and new-high new-low breadth signals
- 1999Index-fund positions as a majority-vote committee
- 2000Tick, tiki and TRIN as a three-layer session confirmation stack
- 2000Constructing an advance-decline oscillator from one listed tape
- 2001Market breadth, beta, and volume-price confirmation
- 2001Regime context from relative venue volume, breadth, and intermarket spreads
- 2002When NYSE breadth misreads operating-stock participation
- 2003Two-gate breadth divergence and a trend filter for rally tops
- 2003Market internals confirm or diverge from the index
- 2004Constructing the McClellan oscillator and summation index
- 2005Intraday index-futures divergence as a three-part session hypothesis
- 2005Breadth summation levels as a short-term signal filter
- 2005Checking trend versus range with breadth and divergence
- 2011Constructing a Nasdaq hi-lo index from highs, lows, and issues traded
- 2013Cumulative advance-decline versus a one-year average
- 2013A one-year breadth average as a participation gate
- 2015Falsifying a healthy correction with breadth and support