1988issue C091-3
Constructing an advance-decline divergence oscillator
The archive construction starts with an advance-decline line, then replaces a visual overlay with the percent gap from a one-year regression-expectation. Daily breadth is conviction-weighted so high-participation sessions count more. Only after those steps is a horizon-chi-square-check applied at a predeclared look-ahead.
- An advance-decline line is a running total of advancing minus declining issues and is used to look for buying and selling climaxes.
- Because a raw overlay is observer-dependent, the advance-decline-divergence-oscillator is the percent gap between the industrial average and its one-year regression-expectation.
- Conviction-weighted-breadth divides daily advance-minus-decline by the unchanged count so sessions with few unchanged names receive more weight.
- Only after those construction steps does a horizon-chi-square-check accept or reject the pre-set bullish and bearish marks at a stated look-ahead.
Start from the advance-decline line
A market-breadth series can be built as an advance-decline line, a running total of the daily difference between advancing and declining issues. That construction is used to look for buying and selling climaxes.
The running difference is generally coincident with price and can lag a climax. One reason is that the tally can include preferred and money-rate issues that do not participate in the climax.
A raw overlay is observer-dependent
Overlaying the breadth cumulative on an industrial average is treated as observer-dependent. The series use different units, and the cumulative can start at an arbitrary origin, so a raw difference or percentage is a poor oscillator.
Weight high-participation sessions
The breadth input to the regression is conviction-weighted-breadth: a cumulative of daily advance-minus-decline divided by the unchanged count. That increment enlarges when unchanged names are scarce, so a session with few unchanged names receives more weight.
Rewrite the mismatch as a residual
The advance-decline-divergence-oscillator estimates a typical industrial-average level from a one-year regression on that cumulative breadth. It then reports the percent gap between the actual average and the regression-expectation.
A positive percent gap means the industrial average is running ahead of breadth and is classified bearish in this construction. A negative gap is classified bullish.
Read it against a filtered path
The oscillator is meant to be read against a filtered industrial-average path that ignores swings smaller than 5 percent.
ADDO percent gap versus the DJIA, 1983–1988
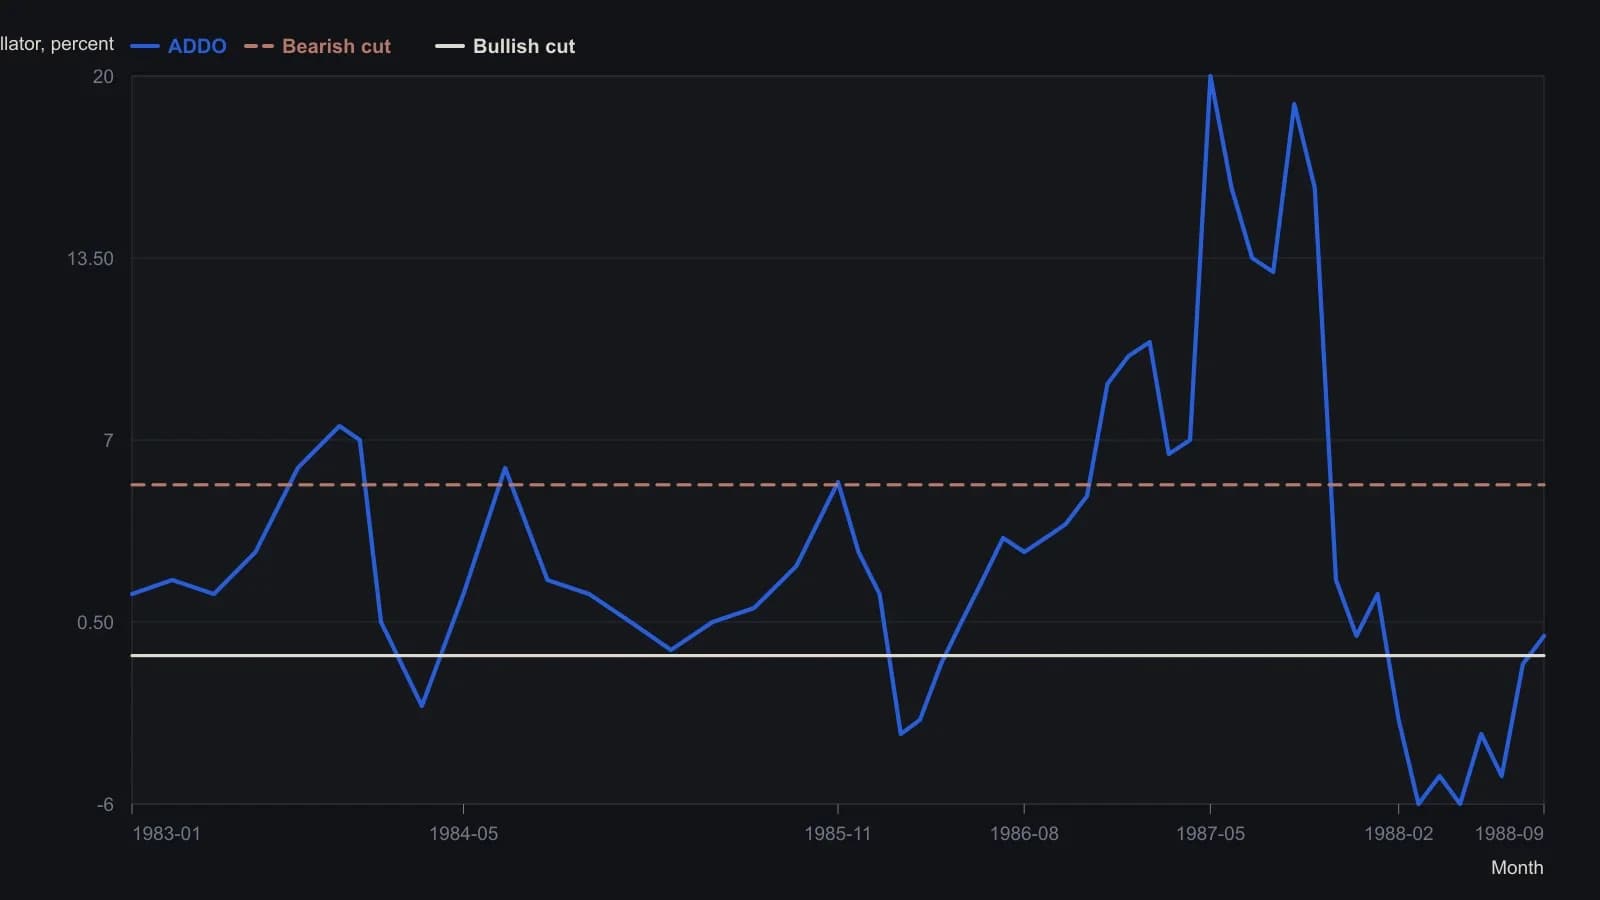
ADDO is the percent amount by which the DJIA leads a one-year regression on Tabell’s conviction-weighted breadth, the running sum of (advances minus declines) divided by unchanged issues. The source treats positive readings as bearish. The −0.7 and +5.4 cuts are two-thirds of a standard deviation from the 1978–1987 weekly mean. Turning-point heights are approximate.
Accept or reject at a predeclared horizon
In a weekly sample from 1978 through 1987, readings below -0.7 and above +5.4 were treated as bullish and bearish marks. Those cuts were set at two-thirds of a standard deviation from the mean.
The marks were checked against the industrial average one, four, 13, 26, and 52 weeks later. A one-degree-of-freedom horizon-chi-square-check was not reported as helpful at one, four, or 13 weeks. The recorded chi-square values were 16 at 26 weeks and 74 at 52 weeks.
All readings on this track · 17 readings
- 1987Testing price-volume agreement after percent reversal filters
- 1988Constructing chi-square tests for two-way price counts
- 1988Building consensus indicators with correlation and the chi-square test
- 1988Test edges against chance, not story
- 1988Constructing an advance-decline divergence oscillator
- 1989Evaluate a contrary put-call premium ratio at a stated horizon
- 1990A weekly resistance-index from hourly volume-per-point
- 1990Testing breadth above moving averages by horizon
- 1990Evaluating member versus odd-lot breadth
- 1990A chi-square test of split frequency histograms across price aggregations
- 1990Evaluating smoothed secondary counts with a chi-square test
- 1991Treat session high and low times as codes, then require a chi-square check
- 1991A signed hourly swing catalog as a next-session chi-square check
- 1992Constructing a chi-square test as a gate for two-way market records
- 1992Percent filters, log point-and-figure, and breadth residuals
- 1997Build a chi-square stationarity screen before you forecast
- 1998Timed breakout rules after a nested-bar contraction