1992issue C051-12
A three-layer audit: regime, breadth, and group RSI
Before an equity idea was allowed to stand alone, the archive workflow named the bond-rate-currency regime, tested whether participation was broadening or quietly topping, and required the industry group's relative strength index to agree. The piece is a nesting habit, not a sector call.
- Intermarket analysis placed one name inside bonds, policy rates, currencies, and cross-border flows before the stock chart was allowed to stand alone.
- Market breadth then asked whether an average's new high was widely shared or whether leadership had already narrowed.
- Weekly group work used a 15-period relative strength index on a five-year sample and still required a positive comparative relative-strength reading above the 10-week and 30-week averages.
- Editorial reading: the method is a habit of nesting one chart inside portfolio weather, not a period call about which sector to own.
Before a name could stand alone
A trading floor that seated equities, convertibles, corporates, and municipals within earshot was used to argue that a move in one market often changed another. Foreign investor flows into and out of U.S. markets were tabulated from the early 1970s.
That seating was the practical case for intermarket analysis: reading equities against bonds, policy rates, currencies, and cross-border flows so one name sits inside a weeks-to-months market regime. The stock chart was not the first document. It was the last one allowed to speak.
Name the bond-rate-currency regime
At an equity low, an accommodative policy and bond-market setting was treated as required context. Once activity recovered, stronger stocks were not assumed to keep confirming bonds, because credit demand would create friction. The regime could help the low and later stop helping the leaders.
Major foreign indexes were watched daily because capital was said to move faster across borders. A strong dollar was treated as a magnet for foreign buying of U.S. stocks and bonds that would, if extreme and persistent, later pressure export-oriented industrials. The 1987 foreign-flow reversal was attributed to a currency clash rather than to derivatives creating the trend.
Test whether the move is widely shared
Market breadth meant participation measures: advancing versus declining issues and volume, new-high versus new-low differentials, most-actives, and climax percentages. They were used to test whether an average's move was widely shared.
By the late 1960s leadership had already narrowed, so breadth peaked years before the 1972-73 rally. Averages printed new highs while former leaders built large non-accumulation tops and then lost support. A new high in the average was not treated as proof that the list was healthy.
The 1974 low was framed as a tested selling climax. Repeated sessions with more than 70% of issues advancing, plus heavy upside volume, were treated as unusual demand and later recast as advance-to-decline issue and volume ratios.
Weight confirmation over any single reading
Daily conclusions were assembled from a market diary plus rate-of-change and second-order acceleration on major indexes, high-low differentials, most-actives, block activity, multi-length Arms averages, 10-day advance/decline series, and on-balance volume. Weight sat on confirmation and divergence rather than on any single reading.
Rate-of-change acceleration meant a 12-month rate of change on a market average, then the rate of change of that series, used to spot fading momentum while price is still rising.
A 10-day average of the new-high minus new-low differential was marked stretched above +150 and washed out below -150. A 10-day Arms average was marked stretched at 0.80 and washed out above 1.25. On-balance volume added New York volume on up closes and subtracted it on down closes to confirm price direction.
Require the group's relative strength index
Weekly group work used a 15-period relative strength index on a five-year sample, with stochastics and standard-parameter MACD as backups. The relative strength index is a bounded oscillator on a fixed lookback of ordered group or index observations. It was used to compare groups and judge whether leadership was improving.
Candidates then had to sit above the 10-week and 30-week moving averages with a positive comparative-relative-strength reading. Comparative relative strength is a ranking of one price series against another, distinct from the oscillator, and was used on weekly charts to see whether a stock or group was outperforming. The oscillator and the ranking had to agree. The averages had to agree as well.
Keep leadership spreads in view
A capital-goods-to-consumer-goods ratio was kept because long-dormant capital-goods bases were appearing while 1980s consumer-growth leadership had not clearly topped. The ratio asks whether dormant producer and industrial groups are taking leadership from long-running consumer growth names.
Small-capitalization strength was treated as able to persist even if the industrial average declined, as in 1977. An average could sag while another sleeve stayed firm. That was another reason not to let one benchmark stand in for the whole book.
Editorial. Those spreads keep rotation visible. They are not read here as a standing instruction to own capital goods, consumer names, or small-capitalization stocks.
10-day new-high minus new-low differential, 1990–92
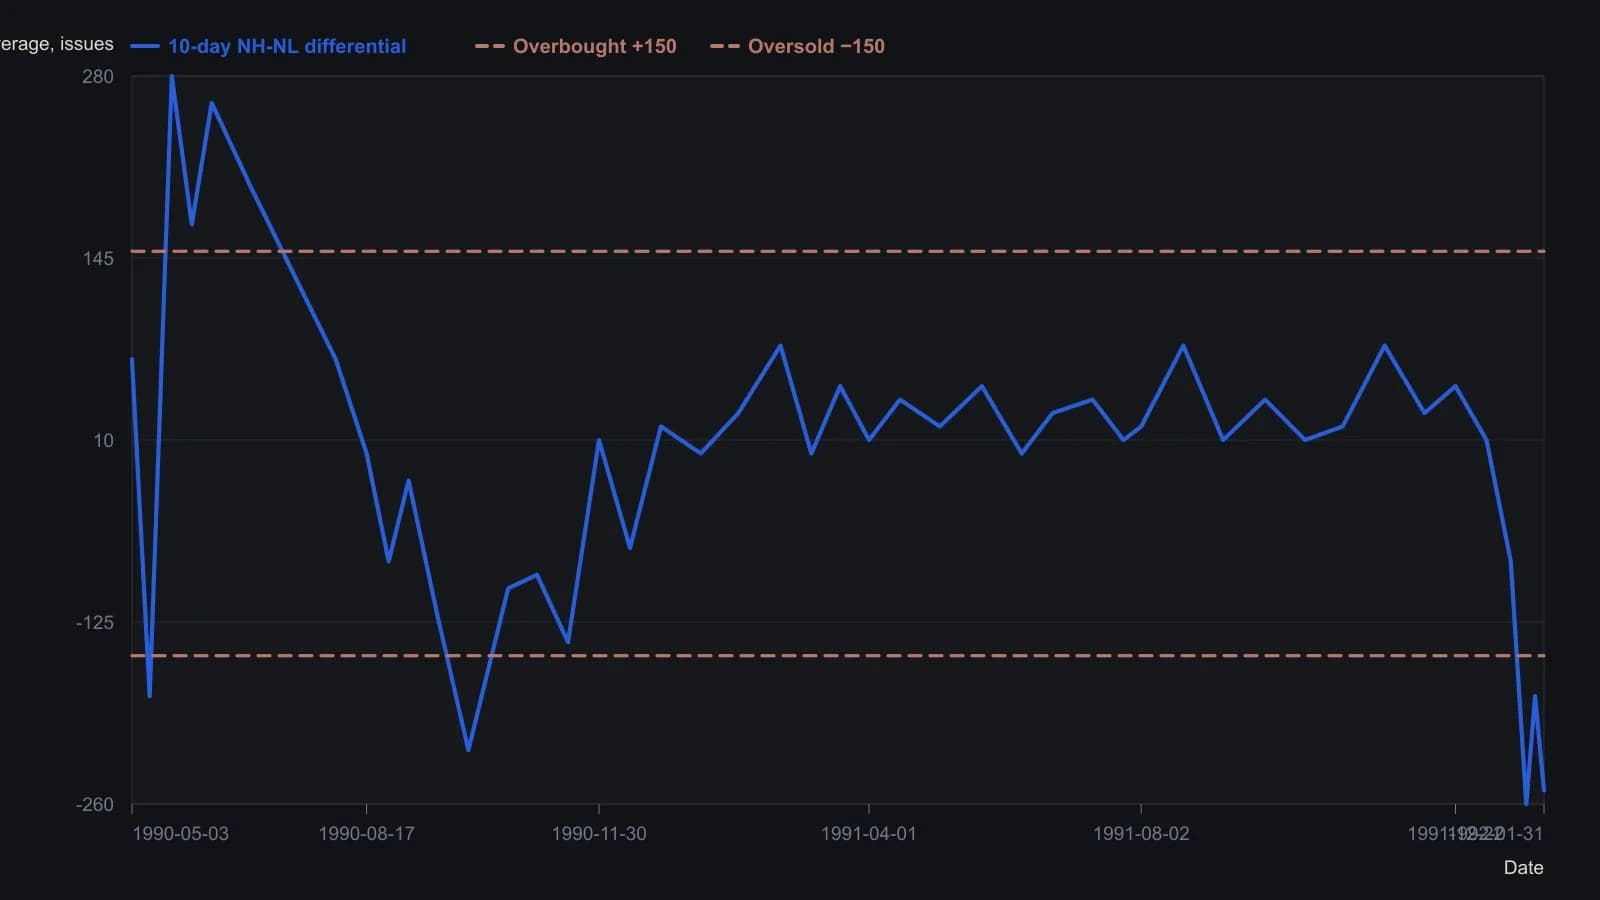
Y values are read from the raster to the nearest 10 issues; the source printed no table. The +150 and −150 lines are the overbought and oversold levels named in the article.
Leave on the same weekly rules
A break of the 30-week average, often joined by fading comparative relative strength, was the practical exit line for trading accounts. Longer-horizon accounts added a company review only if large distribution appeared.
Editorial. The same nest applies on the way out. A broken weekly average is read with fading group rank, with breadth that may already have narrowed, and with a bond-rate-currency regime that may no longer be accommodative. The archive is a sequence of checks, not a license for a lone chart.
All readings on this track · 71 readings
- 1987How a failed rebound, weak breadth, and cycle dates broke the 1987 bull case
- 1988Diagnosing market bottoms with breadth, divergence and averages
- 1988Diagnosing index tops with breadth divergences
- 1988Record highs versus seven-day breadth and divergence
- 1989Constructing a percentage-scaled internals composite
- 1989Constructing a weekly block-tick breadth z-score
- 1989Constructing a dual-rate advance-decline oscillator
- 1989Normalize advance-decline series for a common-scale comparison
- 1990Unchanged-issue share as a narrow-breadth case study
- 1990Evaluating daily and weekly unsigned plurality breadth
- 1990Constructing paired new-high and new-low breadth indicators
- 1990Ten-day HI/LO extremes as a long-horizon breadth signal
- 1990Confirming index cycles with breadth, volume, and waves
- 1990Index cycle gates from breadth and volume
- 1990Constructing advance-decline breadth indicators
- 1990Weekly advance-decline oscillator: weight map, extremes, and spike cycle
- 1990Price-weighted construction distorts breadth, support, and trend
- 1991A peak-sequence test from the new-highs-to-advances-ratio
- 1991Fuzzy rules that turn daily market-breadth into a session consensus
- 1991From daily breadth tallies to a weighted consensus signal
- 1991Retesting market-breadth when market structure changes
- 1991Constructing TRIN as a breadth-volume ratio
- 1991Build the market clock before you read a price bar
- 1991A construction audit of the long-horizon trading index
- 1991Independent formula timers kept as a testable combination
- 1992When identical TRIN prints come from different pairings
- 1992Grade closing tick before a next-session breadth hypothesis
- 1992Noncumulative advance-decline swing confirmation
- 1992Five-day sum construction of the trading index
- 1992Daily closing-trin extremes and next-day direction
- 1992A three-layer audit: regime, breadth, and group RSI
- 1992Constructing a nine-state trend, momentum, and breadth score
- 1993Constructing a market-volume-impact rating from nested averages
- 1993When advance-decline confirmation counts the wrong universe
- 1993Constructing breadth momentum from advance-decline smoothing
- 1993Constructing a cumulative market-thrust line
- 1994Three-horizon construction of the Haurlan index
- 1994Checklist-gated session entry in 1993 index futures
- 1994Read one advance-decline pair through three windows
- 1994Constructing calibrated market-breadth summation indexes
- 1994Constructing a two-speed advance-decline oscillator and a calibrated summation
- 1995NYSE tick extremes and candlestick reversal entries
- 1995Assembling range, breadth, and a stored stop into one procedure
- 1995Restating market breadth timing rules as ratios
- 1995Constructing breadth ratio gates after lookback drawdowns
- 1995Building a short-range breadth and price oscillator
- 1996Constructing a smoothed advance-decline trend filter
- 1996Smoothed advance-decline alerts at the 1987 and 1990 turning points
- 1996Constructing breadth, RSI, and stochastic range filters
- 1996New-high and new-low counts as a breadth construction
- 1996Constructing the four-input breadth-volume ratio
- 1996Constructing the McClellan oscillator and a calibrated summation index
- 1996Declare the oscillator seed, then calibrate only the summation index
- 1997Three-gate centered strength in market-breadth construction
- 1997Daily advance-decline and new-high new-low breadth signals
- 1999Index-fund positions as a majority-vote committee
- 2000Tick, tiki and TRIN as a three-layer session confirmation stack
- 2000Constructing an advance-decline oscillator from one listed tape
- 2001Market breadth, beta, and volume-price confirmation
- 2001Regime context from relative venue volume, breadth, and intermarket spreads
- 2002When NYSE breadth misreads operating-stock participation
- 2003Two-gate breadth divergence and a trend filter for rally tops
- 2003Market internals confirm or diverge from the index
- 2004Constructing the McClellan oscillator and summation index
- 2005Intraday index-futures divergence as a three-part session hypothesis
- 2005Breadth summation levels as a short-term signal filter
- 2005Checking trend versus range with breadth and divergence
- 2011Constructing a Nasdaq hi-lo index from highs, lows, and issues traded
- 2013Cumulative advance-decline versus a one-year average
- 2013A one-year breadth average as a participation gate
- 2015Falsifying a healthy correction with breadth and support