2005issue C121-5
Breadth summation levels as a short-term signal filter
A calibrated breadth-summation does not pick entries. It scores the participation climate and, as a trend-filter, decides whether shorter-term signals are allowed to fire.
- Market-breadth asks how many issues are participating, not where a single index has traveled.
- A breadth-summation turns the daily breadth-oscillator into a persistent climate score once zero-level-calibration makes the bands comparable.
- Ratio-adjusted-net-advances keep a growing listing from distorting longer-horizon comparisons.
- Editorial reading: the trend-filter is a permission-switch that licenses or vetoes shorter-term tools rather than replacing them.
A trigger is not a climate
A short-term setup is a trigger. It asks whether a repeatable chart condition is present right now. Market-breadth asks a slower question: whether participation across advancing and declining issues supports acting on that trigger at all.
Editorial reading: a calibrated long-horizon breadth-accumulation band does not pick entries. It decides whether any shorter-term signal is even allowed to fire. That is regime-dependence. The same setup is only worth considering when the broader participation climate is supportive.
How the breadth-summation is built
The historical series began with a daily breadth-oscillator: the spread between a faster and a slower exponential average of net advances. That oscillator was the daily increment of a breadth-summation, a running total whose level, once calibrated, is read as a persistent climate score.
The increment used ratio-adjusted-net-advances, meaning net advances scaled by advancing plus declining issues. The ratio form was used so a growing exchange listing would not distort longer-horizon comparisons.
Why the printed level needs calibration
Because the series is a running sum, its printed level depends on the start date and on any missing or erroneous observations along the path. Without an adjustment, the same climate would print as a different number if the series began on a different day.
A zero-level-calibration that uses only the current faster and slower exponential averages was introduced so the same index level can be reconstructed for any historical date. After that starting-point adjustment, the same numerical bands stay comparable no matter when the series begins.
The summation as a permission-switch
The archive treated the calibrated level as a trend-filter. Exposure was defined as long the related composite while the summation stayed above a chosen level, and flat once it crossed back below. Unused cash was assigned money-market interest while the rule was flat. A later multi-year chart of the same series marked zero and a higher elevated band as the levels above which the composite was generally rising, and overlaid a longer average of price as a second filter.
The summation level was framed as a climate gate for shorter-term tools: slower satellite timing and fewer trades when the reading is elevated, and avoidance of overexposure when it is below zero.
Editorial reading: that gate is a permission-switch. It is a higher-level on or off condition that licenses or vetoes shorter-term timing tools. It does not replace those tools, and it does not, by itself, say when to enter.
Time invested and NASDAQ returns by summation level
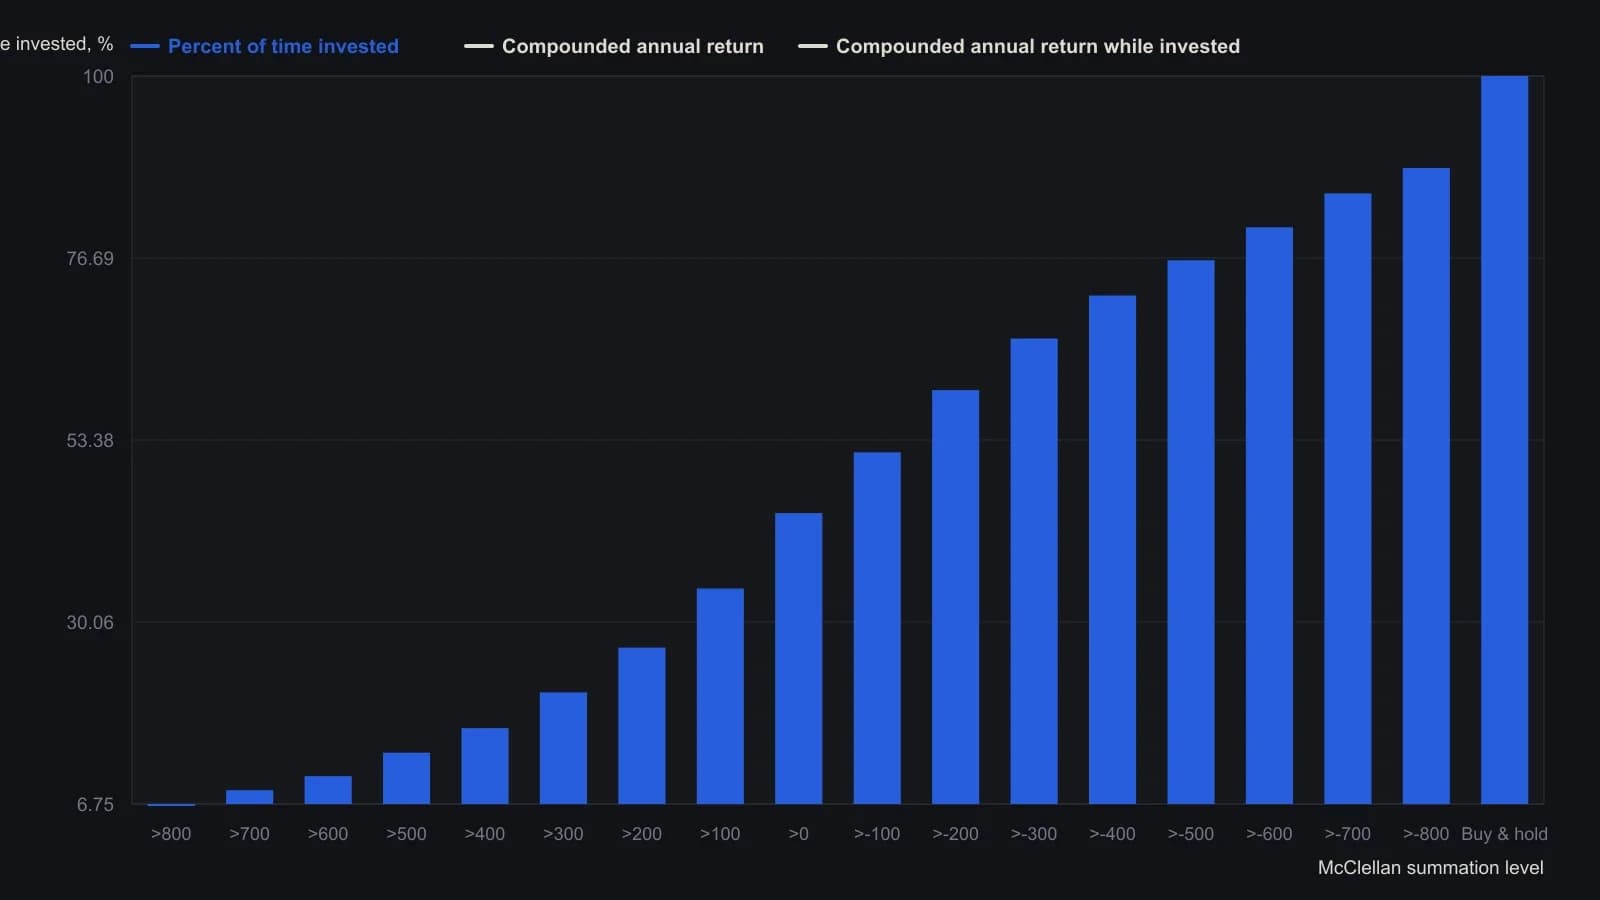
Each row is a long-only rule: buy the NASDAQ Composite when the ratio-adjusted, zero-calibrated McClellan summation crosses above that level and exit when it falls back through. Compounded annual return credits money-market rates on cash days. Breadth input is NASDAQ advances and declines as (A−D)/(A+D).
All readings on this track · 71 readings
- 1987How a failed rebound, weak breadth, and cycle dates broke the 1987 bull case
- 1988Diagnosing market bottoms with breadth, divergence and averages
- 1988Diagnosing index tops with breadth divergences
- 1988Record highs versus seven-day breadth and divergence
- 1989Constructing a percentage-scaled internals composite
- 1989Constructing a weekly block-tick breadth z-score
- 1989Constructing a dual-rate advance-decline oscillator
- 1989Normalize advance-decline series for a common-scale comparison
- 1990Unchanged-issue share as a narrow-breadth case study
- 1990Evaluating daily and weekly unsigned plurality breadth
- 1990Constructing paired new-high and new-low breadth indicators
- 1990Ten-day HI/LO extremes as a long-horizon breadth signal
- 1990Confirming index cycles with breadth, volume, and waves
- 1990Index cycle gates from breadth and volume
- 1990Constructing advance-decline breadth indicators
- 1990Weekly advance-decline oscillator: weight map, extremes, and spike cycle
- 1990Price-weighted construction distorts breadth, support, and trend
- 1991A peak-sequence test from the new-highs-to-advances-ratio
- 1991Fuzzy rules that turn daily market-breadth into a session consensus
- 1991From daily breadth tallies to a weighted consensus signal
- 1991Retesting market-breadth when market structure changes
- 1991Constructing TRIN as a breadth-volume ratio
- 1991Build the market clock before you read a price bar
- 1991A construction audit of the long-horizon trading index
- 1991Independent formula timers kept as a testable combination
- 1992When identical TRIN prints come from different pairings
- 1992Grade closing tick before a next-session breadth hypothesis
- 1992Noncumulative advance-decline swing confirmation
- 1992Five-day sum construction of the trading index
- 1992Daily closing-trin extremes and next-day direction
- 1992A three-layer audit: regime, breadth, and group RSI
- 1992Constructing a nine-state trend, momentum, and breadth score
- 1993Constructing a market-volume-impact rating from nested averages
- 1993When advance-decline confirmation counts the wrong universe
- 1993Constructing breadth momentum from advance-decline smoothing
- 1993Constructing a cumulative market-thrust line
- 1994Three-horizon construction of the Haurlan index
- 1994Checklist-gated session entry in 1993 index futures
- 1994Read one advance-decline pair through three windows
- 1994Constructing calibrated market-breadth summation indexes
- 1994Constructing a two-speed advance-decline oscillator and a calibrated summation
- 1995NYSE tick extremes and candlestick reversal entries
- 1995Assembling range, breadth, and a stored stop into one procedure
- 1995Restating market breadth timing rules as ratios
- 1995Constructing breadth ratio gates after lookback drawdowns
- 1995Building a short-range breadth and price oscillator
- 1996Constructing a smoothed advance-decline trend filter
- 1996Smoothed advance-decline alerts at the 1987 and 1990 turning points
- 1996Constructing breadth, RSI, and stochastic range filters
- 1996New-high and new-low counts as a breadth construction
- 1996Constructing the four-input breadth-volume ratio
- 1996Constructing the McClellan oscillator and a calibrated summation index
- 1996Declare the oscillator seed, then calibrate only the summation index
- 1997Three-gate centered strength in market-breadth construction
- 1997Daily advance-decline and new-high new-low breadth signals
- 1999Index-fund positions as a majority-vote committee
- 2000Tick, tiki and TRIN as a three-layer session confirmation stack
- 2000Constructing an advance-decline oscillator from one listed tape
- 2001Market breadth, beta, and volume-price confirmation
- 2001Regime context from relative venue volume, breadth, and intermarket spreads
- 2002When NYSE breadth misreads operating-stock participation
- 2003Two-gate breadth divergence and a trend filter for rally tops
- 2003Market internals confirm or diverge from the index
- 2004Constructing the McClellan oscillator and summation index
- 2005Intraday index-futures divergence as a three-part session hypothesis
- 2005Breadth summation levels as a short-term signal filter
- 2005Checking trend versus range with breadth and divergence
- 2011Constructing a Nasdaq hi-lo index from highs, lows, and issues traded
- 2013Cumulative advance-decline versus a one-year average
- 2013A one-year breadth average as a participation gate
- 2015Falsifying a healthy correction with breadth and support