1992issue C031-3
Five-day sum construction of the trading index
The daily trading index is the advancing-to-declining issue ratio divided by the advancing-to-declining volume ratio. A ten-day average and an undivided five-day sum of that series use different overbought and oversold bands.
- A daily trading index is built by dividing the advancing-to-declining issue ratio by the advancing-to-declining volume ratio.
- A ten-day moving average of that index treats readings above 1.00 as oversold and readings below 0.80 as overbought.
- An undivided five-day sum of the same closes treats totals below 4.00 as overbought and near market tops, and totals above 6.00 as oversold and near market bottoms.
- After the five-day sum falls below 4.00 and then turns higher, the construction places a short-term top within one to four days.
The daily trading index
A daily trading index is built by dividing the advancing-to-declining issue ratio by the advancing-to-declining volume ratio.
Market-breadth is the advancing-versus-declining issue count that forms the numerator of that daily trading index. Volume-price analysis is the advancing-versus-declining volume ratio that forms the denominator.
A ten-day average
One common construction applies a ten-day moving average to the daily trading index and treats readings above 1.00 as oversold and readings below 0.80 as overbought.
That moving average is a ten-day average of daily trading-index values, used as one smoother of the same series the five-day construction leaves as a raw sum.
An undivided five-day sum
An alternative construction adds the last five daily trading-index closes and does not divide that total by five.
The five-day undivided sum is treated as overbought below 4.00 and oversold above 6.00. In that five-day construction, sums below 4.00 are placed near market tops and sums above 6.00 near market bottoms.
A plotted sample and the turn window
A plotted sample of the five-day sum from April 1990 through October 7, 1991 marks each extreme above 6.00 with a down arrow and each extreme below 4.00 with an up arrow.
After the five-day sum falls below 4.00 and then turns higher, the construction places a short-term top within one to four days.
TRIN-5, April 1990–October 1991
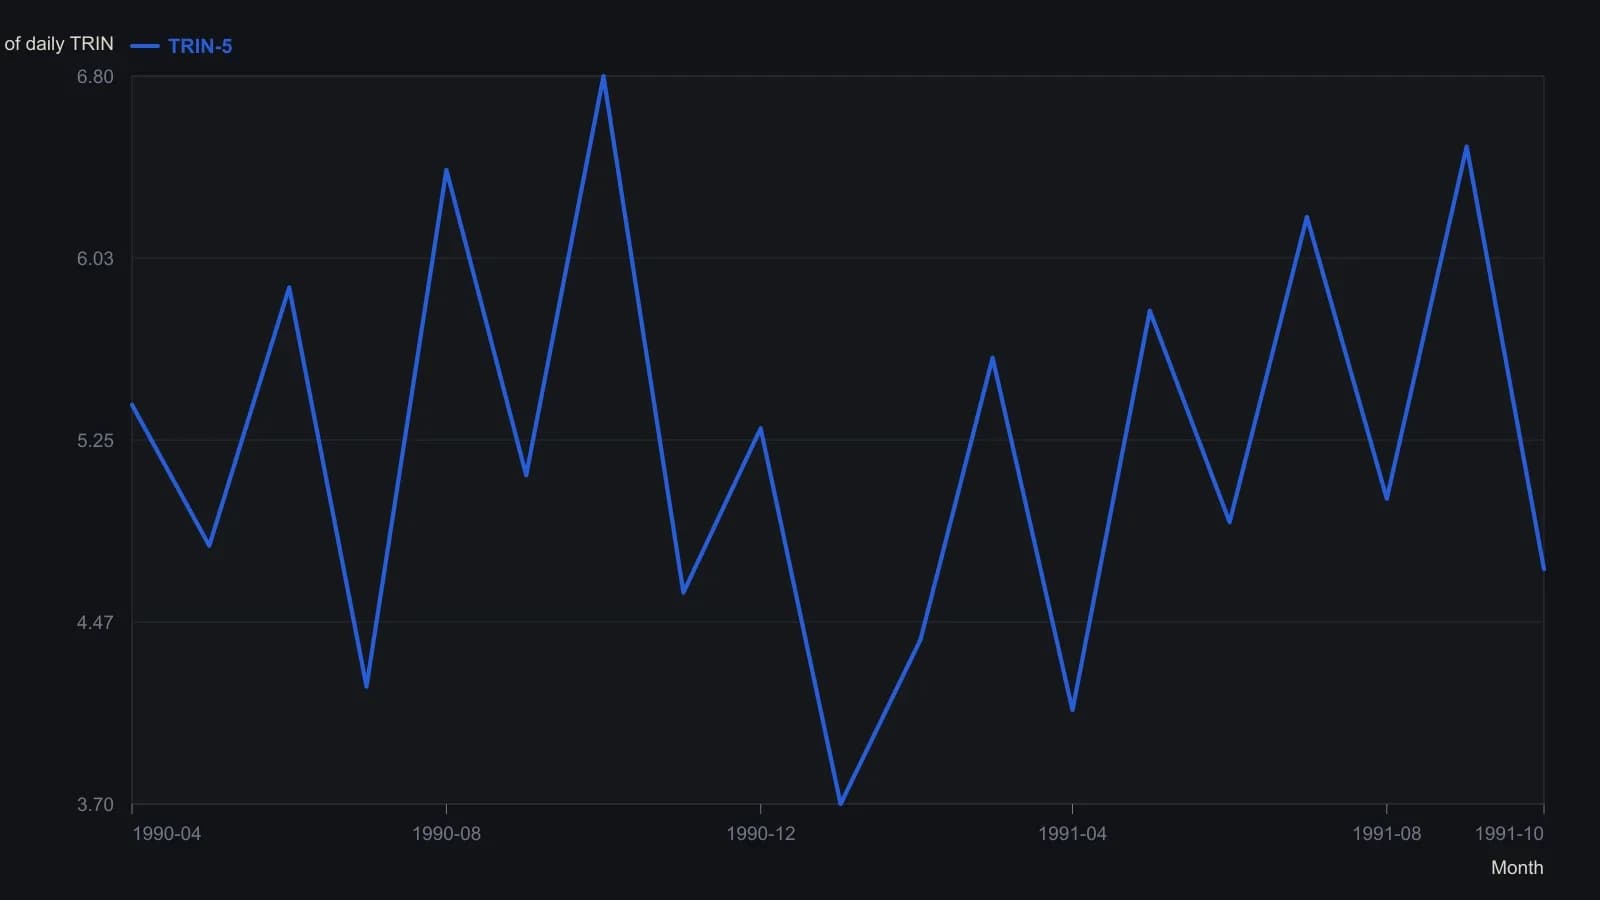
Y values are approximate readings from the published raster; daily TRIN prints are not tabulated. Oversold is the source’s 6.00 band and overbought is 4.00; the sum is not divided by five.
All readings on this track · 71 readings
- 1987How a failed rebound, weak breadth, and cycle dates broke the 1987 bull case
- 1988Diagnosing market bottoms with breadth, divergence and averages
- 1988Diagnosing index tops with breadth divergences
- 1988Record highs versus seven-day breadth and divergence
- 1989Constructing a percentage-scaled internals composite
- 1989Constructing a weekly block-tick breadth z-score
- 1989Constructing a dual-rate advance-decline oscillator
- 1989Normalize advance-decline series for a common-scale comparison
- 1990Unchanged-issue share as a narrow-breadth case study
- 1990Evaluating daily and weekly unsigned plurality breadth
- 1990Constructing paired new-high and new-low breadth indicators
- 1990Ten-day HI/LO extremes as a long-horizon breadth signal
- 1990Confirming index cycles with breadth, volume, and waves
- 1990Index cycle gates from breadth and volume
- 1990Constructing advance-decline breadth indicators
- 1990Weekly advance-decline oscillator: weight map, extremes, and spike cycle
- 1990Price-weighted construction distorts breadth, support, and trend
- 1991A peak-sequence test from the new-highs-to-advances-ratio
- 1991Fuzzy rules that turn daily market-breadth into a session consensus
- 1991From daily breadth tallies to a weighted consensus signal
- 1991Retesting market-breadth when market structure changes
- 1991Constructing TRIN as a breadth-volume ratio
- 1991Build the market clock before you read a price bar
- 1991A construction audit of the long-horizon trading index
- 1991Independent formula timers kept as a testable combination
- 1992When identical TRIN prints come from different pairings
- 1992Grade closing tick before a next-session breadth hypothesis
- 1992Noncumulative advance-decline swing confirmation
- 1992Five-day sum construction of the trading index
- 1992Daily closing-trin extremes and next-day direction
- 1992A three-layer audit: regime, breadth, and group RSI
- 1992Constructing a nine-state trend, momentum, and breadth score
- 1993Constructing a market-volume-impact rating from nested averages
- 1993When advance-decline confirmation counts the wrong universe
- 1993Constructing breadth momentum from advance-decline smoothing
- 1993Constructing a cumulative market-thrust line
- 1994Three-horizon construction of the Haurlan index
- 1994Checklist-gated session entry in 1993 index futures
- 1994Read one advance-decline pair through three windows
- 1994Constructing calibrated market-breadth summation indexes
- 1994Constructing a two-speed advance-decline oscillator and a calibrated summation
- 1995NYSE tick extremes and candlestick reversal entries
- 1995Assembling range, breadth, and a stored stop into one procedure
- 1995Restating market breadth timing rules as ratios
- 1995Constructing breadth ratio gates after lookback drawdowns
- 1995Building a short-range breadth and price oscillator
- 1996Constructing a smoothed advance-decline trend filter
- 1996Smoothed advance-decline alerts at the 1987 and 1990 turning points
- 1996Constructing breadth, RSI, and stochastic range filters
- 1996New-high and new-low counts as a breadth construction
- 1996Constructing the four-input breadth-volume ratio
- 1996Constructing the McClellan oscillator and a calibrated summation index
- 1996Declare the oscillator seed, then calibrate only the summation index
- 1997Three-gate centered strength in market-breadth construction
- 1997Daily advance-decline and new-high new-low breadth signals
- 1999Index-fund positions as a majority-vote committee
- 2000Tick, tiki and TRIN as a three-layer session confirmation stack
- 2000Constructing an advance-decline oscillator from one listed tape
- 2001Market breadth, beta, and volume-price confirmation
- 2001Regime context from relative venue volume, breadth, and intermarket spreads
- 2002When NYSE breadth misreads operating-stock participation
- 2003Two-gate breadth divergence and a trend filter for rally tops
- 2003Market internals confirm or diverge from the index
- 2004Constructing the McClellan oscillator and summation index
- 2005Intraday index-futures divergence as a three-part session hypothesis
- 2005Breadth summation levels as a short-term signal filter
- 2005Checking trend versus range with breadth and divergence
- 2011Constructing a Nasdaq hi-lo index from highs, lows, and issues traded
- 2013Cumulative advance-decline versus a one-year average
- 2013A one-year breadth average as a participation gate
- 2015Falsifying a healthy correction with breadth and support