1989issue C011-7
Constructing a percentage-scaled internals composite
A breadth-composite is built by converting net advances, net up volume, and net new highs into percentages of their own bases, summing those percentages into an algebraic-net, and accumulating that net. The relative path of the series is then used to draw a parallel-channel and to read price-breadth-divergence against a price average.
- Convert net advances minus declines, net up minus down volume, and net new highs minus new lows into percentages of their own bases so raw scale cannot dominate the composite.
- Sum those three terms into an algebraic-net and add that net to the prior composite value. Only the relative path of the accumulated series is used.
- Adjust a lopsided dividend-capture-volume burst before computing volume-percent. An even split already cancels inside that term.
- Draw a parallel-channel on the composite and read a split versus a price average as price-breadth-divergence, then check that split against the later price path.
Scale three internals to percent of their own bases
A breadth-composite is an accumulated series built from same-day percentage internals rather than from a price-weighted market average. The construction converts net advances minus declines, net up minus down volume, and net new highs minus new lows into percentages of their own bases, sums those percentages into a same-day algebraic-net, and accumulates that net.
Each internal is expressed as a percent of its own total so that issue counts, share volume, and new-high and new-low counts cannot dominate the composite through raw scale.
Accumulate the algebraic net
The three percentage terms are advance-decline-percent, volume-percent, and high-low-percent. They are defined as net advances over total issues, net advancing volume over total volume, and net new highs over total issues, each multiplied by 100. The algebraic-net is the same-day sum of those three terms, and that sum is added to the prior composite value.
Only the relative path of the accumulated series is used. The starting level may be set for convenience. Weekly inputs may replace daily inputs if less path sensitivity is acceptable.
Adjust lopsided dividend-capture volume first
A lopsided dividend-capture-volume burst should be adjusted before the volume-percent term is computed. An even split cancels because that term is already a share of total volume.
Worked example: three internals scaled to percent, then summed
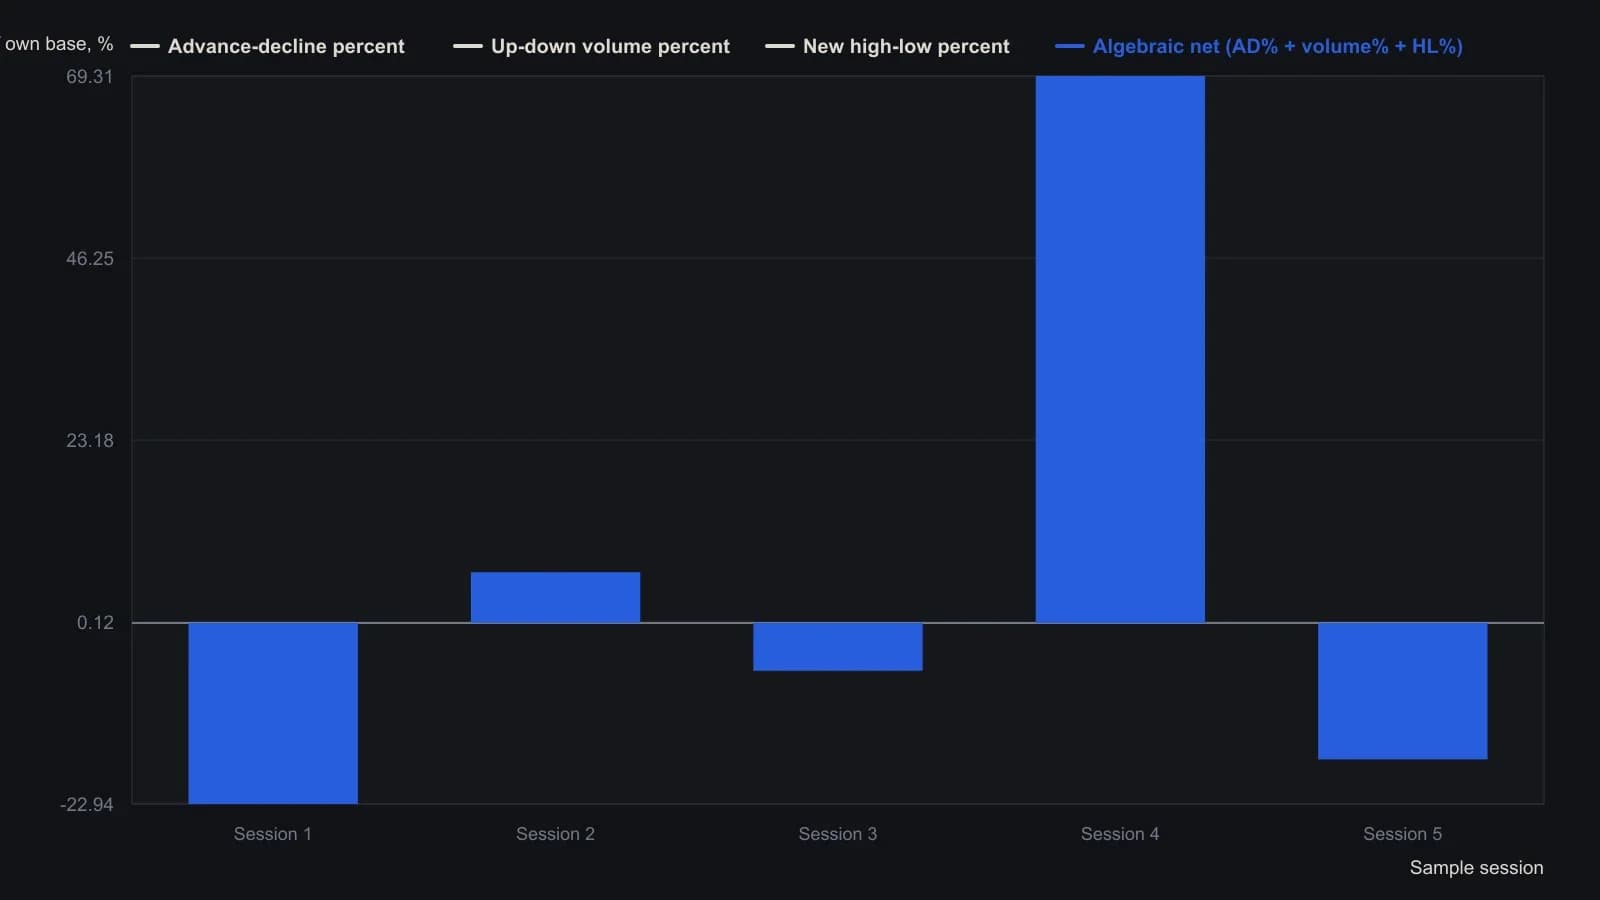
The source starts the index at zero on the first row so that day’s net equals the printed Technical Index. Later rows keep their own prior value; only the four percentage columns are plotted.
Compare the accumulated path with a headline average
After the October 1987 break, a 0-100 normalized overlay showed the breadth-composite and an exchange headline average keeping similar shape after their levels separated. The volume-percent sub-series was the component holding the composite up against a declining advance-decline-percent sub-series.
In the documented window, the September-December 1987 decline retraced 55% of the July 1986-August 1987 rise on the composite versus 117% on the exchange headline average. By the end of June 1988 the composite had recovered 91% of that decline versus 47% for the headline average.
Copy support and resistance as a parallel channel
A parallel-channel on the composite is drawn by connecting two highs or two lows, copying that line through the intervening extreme, and extending both lines. The same geometry on the exchange headline average over the same span left the December 4, 1987 low below the copied support and broke the up-channel on a one-day plunge that stayed inside the composite channel.
Read a split as price-breadth divergence
Price-breadth-divergence is read as a split between the composite and a price average, then checked against the later price path. The historical workflow marked such splits versus both an industrial average and an exchange headline average.
All readings on this track · 71 readings
- 1987How a failed rebound, weak breadth, and cycle dates broke the 1987 bull case
- 1988Diagnosing market bottoms with breadth, divergence and averages
- 1988Diagnosing index tops with breadth divergences
- 1988Record highs versus seven-day breadth and divergence
- 1989Constructing a percentage-scaled internals composite
- 1989Constructing a weekly block-tick breadth z-score
- 1989Constructing a dual-rate advance-decline oscillator
- 1989Normalize advance-decline series for a common-scale comparison
- 1990Unchanged-issue share as a narrow-breadth case study
- 1990Evaluating daily and weekly unsigned plurality breadth
- 1990Constructing paired new-high and new-low breadth indicators
- 1990Ten-day HI/LO extremes as a long-horizon breadth signal
- 1990Confirming index cycles with breadth, volume, and waves
- 1990Index cycle gates from breadth and volume
- 1990Constructing advance-decline breadth indicators
- 1990Weekly advance-decline oscillator: weight map, extremes, and spike cycle
- 1990Price-weighted construction distorts breadth, support, and trend
- 1991A peak-sequence test from the new-highs-to-advances-ratio
- 1991Fuzzy rules that turn daily market-breadth into a session consensus
- 1991From daily breadth tallies to a weighted consensus signal
- 1991Retesting market-breadth when market structure changes
- 1991Constructing TRIN as a breadth-volume ratio
- 1991Build the market clock before you read a price bar
- 1991A construction audit of the long-horizon trading index
- 1991Independent formula timers kept as a testable combination
- 1992When identical TRIN prints come from different pairings
- 1992Grade closing tick before a next-session breadth hypothesis
- 1992Noncumulative advance-decline swing confirmation
- 1992Five-day sum construction of the trading index
- 1992Daily closing-trin extremes and next-day direction
- 1992A three-layer audit: regime, breadth, and group RSI
- 1992Constructing a nine-state trend, momentum, and breadth score
- 1993Constructing a market-volume-impact rating from nested averages
- 1993When advance-decline confirmation counts the wrong universe
- 1993Constructing breadth momentum from advance-decline smoothing
- 1993Constructing a cumulative market-thrust line
- 1994Three-horizon construction of the Haurlan index
- 1994Checklist-gated session entry in 1993 index futures
- 1994Read one advance-decline pair through three windows
- 1994Constructing calibrated market-breadth summation indexes
- 1994Constructing a two-speed advance-decline oscillator and a calibrated summation
- 1995NYSE tick extremes and candlestick reversal entries
- 1995Assembling range, breadth, and a stored stop into one procedure
- 1995Restating market breadth timing rules as ratios
- 1995Constructing breadth ratio gates after lookback drawdowns
- 1995Building a short-range breadth and price oscillator
- 1996Constructing a smoothed advance-decline trend filter
- 1996Smoothed advance-decline alerts at the 1987 and 1990 turning points
- 1996Constructing breadth, RSI, and stochastic range filters
- 1996New-high and new-low counts as a breadth construction
- 1996Constructing the four-input breadth-volume ratio
- 1996Constructing the McClellan oscillator and a calibrated summation index
- 1996Declare the oscillator seed, then calibrate only the summation index
- 1997Three-gate centered strength in market-breadth construction
- 1997Daily advance-decline and new-high new-low breadth signals
- 1999Index-fund positions as a majority-vote committee
- 2000Tick, tiki and TRIN as a three-layer session confirmation stack
- 2000Constructing an advance-decline oscillator from one listed tape
- 2001Market breadth, beta, and volume-price confirmation
- 2001Regime context from relative venue volume, breadth, and intermarket spreads
- 2002When NYSE breadth misreads operating-stock participation
- 2003Two-gate breadth divergence and a trend filter for rally tops
- 2003Market internals confirm or diverge from the index
- 2004Constructing the McClellan oscillator and summation index
- 2005Intraday index-futures divergence as a three-part session hypothesis
- 2005Breadth summation levels as a short-term signal filter
- 2005Checking trend versus range with breadth and divergence
- 2011Constructing a Nasdaq hi-lo index from highs, lows, and issues traded
- 2013Cumulative advance-decline versus a one-year average
- 2013A one-year breadth average as a participation gate
- 2015Falsifying a healthy correction with breadth and support