2004issue C101-2
Weekly-average and price-channel states on sector depositary baskets
The same 20-week and 50-week simple moving averages classified four industry depositary baskets. A prior-range high or low then confirmed, supported, or vetoed that classifier, so identical lookbacks produced four checkable states.
- The case study applied the same 20-week and 50-week simple moving averages to four industry depositary baskets covering oil-service, biotechnology, telecommunications, and internet companies.
- Each basket was a cancelable depositary product whose holdings were chosen using market capitalization, liquidity, and price-to-earnings among other factors, and could be equally weighted or capitalization-weighted.
- After an earlier rise, the oil-service basket was described as holding near the 50-week simple moving average, while the telecommunications basket still needed a strong move above the fourth-quarter 2002 highs before a more committed bullish case.
- Biotechnology and internet baskets each cleared both weekly averages, then later fell back below them, with biotechnology support identified near the third- and fourth-quarter 2003 lows.
The shared weekly-average pair
The case study applied the same 20-week and 50-week simple moving averages to four industry depositary baskets covering oil-service, biotechnology, telecommunications, and internet companies.
The 20-week simple moving average is the arithmetic mean of weekly closes over a 20-week lookback and is the shorter trend baseline. The 50-week simple moving average is the arithmetic mean of weekly closes over a 50-week lookback and is the longer trend baseline and a pullback reference.
How the baskets were built
Each basket was described as a cancelable depositary product whose holdings were chosen using market capitalization, liquidity, and price-to-earnings among other factors, and could be equally weighted or capitalization-weighted.
A sector depositary basket is an exchange-listed holding of several companies from one industry that can be traded as a single instrument and, in this case study, could be canceled into the underlying shares.
Oil-service basket
The oil-service basket moved above its 20-week simple moving average in the fourth quarter of 2003, then later pulled back and was described as holding near its 50-week simple moving average.
Editorial. That sequence is a supported pullback: a decline that holds at a pre-stated average after an earlier rise above the shorter baseline.
Biotechnology basket
The biotechnology basket cleared its 20-week simple moving average in the fourth quarter of 2002 and its 50-week simple moving average late in the first quarter of 2003, as the shorter average was moving above the longer one. That change of state is an average crossover.
By spring and summer 2004 the biotechnology basket had fallen back below the 20-week average and then the 50-week average, with the next support area identified near the third- and fourth-quarter 2003 lows.
Editorial. The earlier clearance is a breakout with an average crossover. The later slip below both averages is a dual-average breakdown, and the 2003 lows are the price-channel bound named as the next support area.
Telecommunications basket
After the 2002 declines, the telecommunications basket remained inside a slowly contracting trading range, including brief rises above largely flat 20-week and 50-week averages in the second quarter of 2003 and the first quarter of 2004.
A strong move above the fourth-quarter 2002 highs was treated as the price-channel condition required before a more committed bullish case for the telecommunications basket.
Editorial. This is a trapped range. Range contraction is a multi-quarter narrowing of highs and lows, including around flattened weekly averages, that keeps price from establishing a new directional state. Brief rises above the averages were not enough without the prior-range break.
Internet basket
The internet basket cleared its 20-week average in the fourth quarter of 2002 and its 50-week average in the first quarter of 2003, then by the start of the third quarter of 2004 had slipped below both averages.
Editorial. The later reading is a dual-average breakdown. The same weekly-average pair that classified the earlier clearance later reversed that state, still without a change of lookback.
Oil Service HOLDRS weekly price versus 20- and 50-week averages
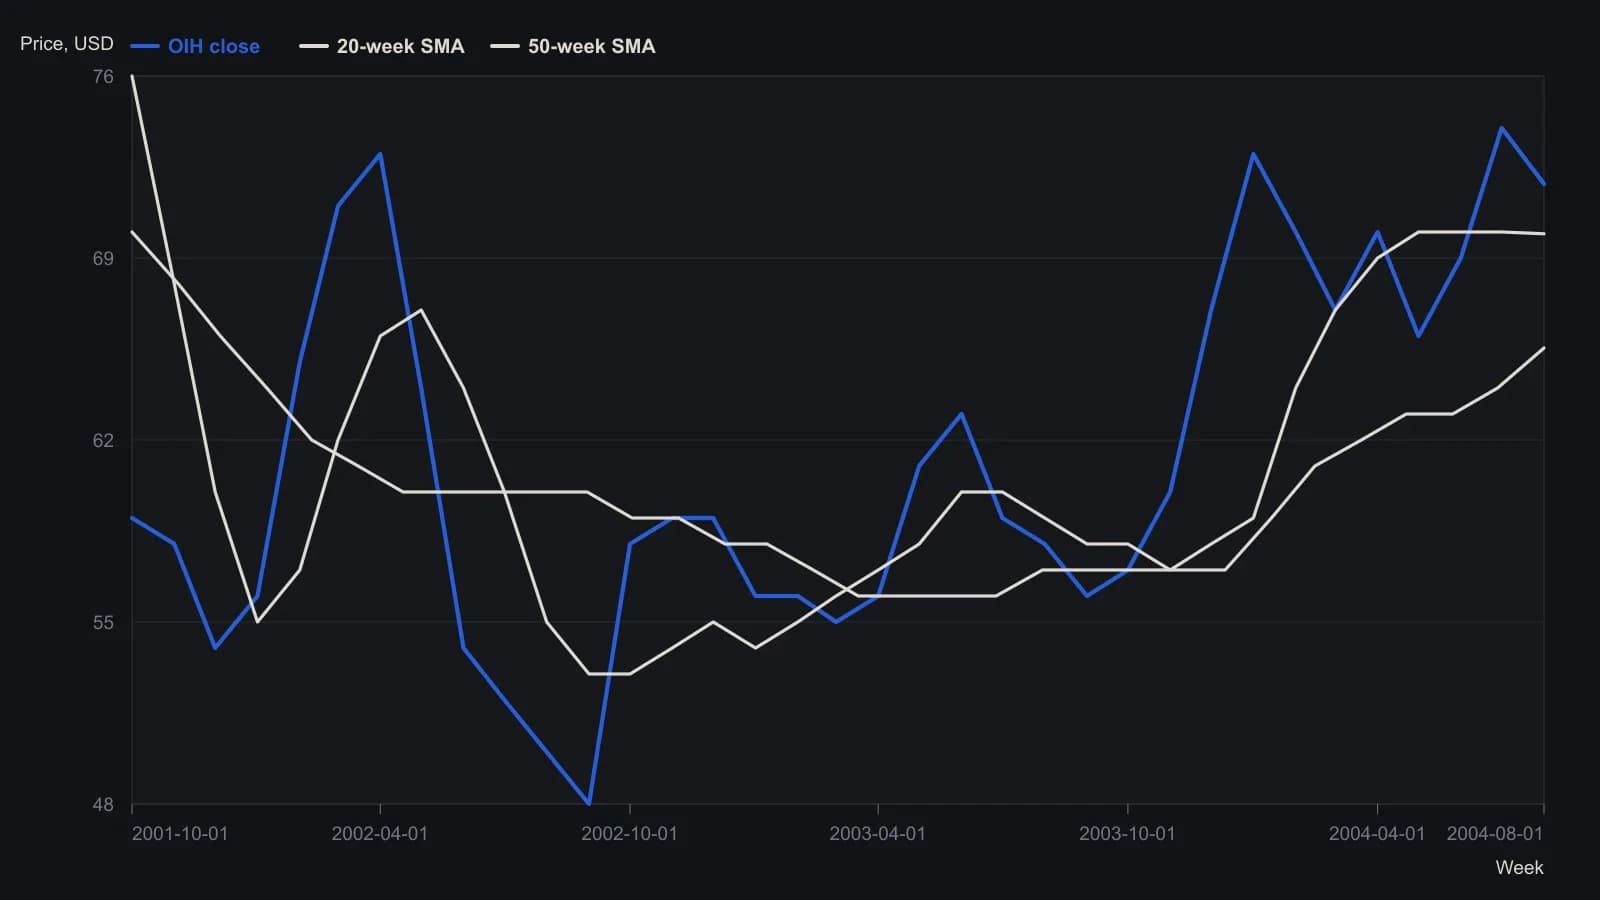
Intermediate points are approximate monthly samples of weekly Prophet Financial Systems bars. Y-axis ticks are 3 dollars, so digitized values are whole dollars except the three last printed quotes. The 50-week average is absent before early 2002 because the lookback had not filled.
All readings on this track · 55 readings
- 1988Constructing price channels from trendlines
- 1988Three-point curved trend channel construction
- 1988Least-squares construction of channel trendlines
- 1988Three-zone price channel from quadratic smoothing
- 1989A variable-sensitivity stochastic built on three-sigma bounds
- 1989Close-minus-average oscillator for channel extremes
- 1989The six-stage hunt as a critique of one-click heroics
- 1990Fair-value gaps and a copper moving-average channel
- 1990Diversify markets, not systems, to cut trend-system variance
- 1991Constructing trendlines, price channels, and close-based breakouts
- 1991Constructing seasonal-cycle overlays with channel confirmation
- 1993Lag-compensated exponential trend channel construction
- 1993Constructing a lead-lag filter and price channel as one stack
- 1993Three stochastic warnings still need price-channel confirmation
- 1993Lead-lag smoothing for weekly trend-channel construction
- 1993Constructing zero-net-lag price channels
- 1995From a downtrend-line break to a regression channel
- 1995Validated trendline and price channel construction
- 1995Constructing price envelopes from averages, volatility, and regression
- 1996Constructing trendlines and channels from explicit swings
- 1998Fifty percent retracement as a channel regime test
- 1998Close-based channel rails as daily scenario maps
- 1999Constructing support, resistance, trendlines, and price channels
- 2001Cycle composites, price channels, and two-sided signals
- 2001Testing horizontal price channels with stops and scale
- 2002A two-stage momentum-shift and price-channel process
- 2002Wave-by-wave channel construction for Elliott counts
- 2002Affine channels as reusable trade hypotheses
- 2004Stress-test seasonal windows across regimes, then add channels
- 2004Regime permission from trendlines, channels, and range edges
- 2004Weekly-average and price-channel states on sector depositary baskets
- 2005Oil services catch-up after channel resistance breaks
- 2005Constructing a volatility-normalized cycle index
- 2005How a Darvas channel becomes a complete entry and exit procedure
- 2005Clustered Fibonacci and channel levels in news-driven forex
- 2005Treat a consolidating currency market as a time-frame problem
- 2005Channel walls that flip roles or recapture price
- 2006Stacking candlesticks, crossovers, and price channels
- 2006Failed uptrend channel breakout left the euro rangebound
- 2006Constructing a Wilson relative price channel from a range-bound strength index
- 2007Range bars change when a Bollinger squeeze counts as a breakout
- 2009One testable SPY procedure for a price channel, a trend rule, and a seasonal overlay
- 2010A gold-miner channel plan from value to false breakouts
- 2010A multi-timeframe channel from value to an overvalued zone
- 2010Asymmetric price channel construction for congested markets
- 2011Phasing many cycles at once with nested envelopes
- 2012Constructing adaptive horizontal price channels
- 2014Confirming support with trendlines, channels, and retracements
- 2015News-sentiment confirmation for support, channel, and volume tests
- 2015A three-layer permission stack: moving averages, a price channel, and weekly levels
- 2016Entropy-diff as a regime switch between trend following and a price channel
- 2017Competing rulers on a pound chart after Brexit
- 2017Test consolidation channel breakouts as one procedure
- 2020Constructing late-trend longs with a price channel, gap breakout, and trailing stop
- 2025Using IBM's multi-year price channel as a breakout teaching case