1988issue C081-10
Three-zone price channel from quadratic smoothing
A quadratic time-series projection with changing velocity and acceleration can be wrapped in a comfort-scaled expected-error band. The result is a timing envelope whose crossings partition the chart into deteriorating, neutral, and improving regions, unlike a moving-average cross that does not extrapolate.
- The channel is a timing envelope for entering and exiting a security, not a device that projects how far price will travel.
- Bounds are formed by adding and subtracting a comfort-scaled expected-error term from a quadratic forecast whose coefficients are allowed to change.
- Price leaving the envelope marks a break in the assumed trend and partitions the chart into deteriorating, neutral, and improving regions.
- The channel and a moving average both generate signals from price crossing a computed line, but the channel is designed to extrapolate and to place greater weight on recent observations.
A timing envelope, not a travel forecast
The channel is framed as a timing envelope for entering and exiting a security. It is not a device that projects how far price will travel.
The price channel is the pair of comfort-scaled bounds traced through time. It turns the forecast into an objective envelope instead of a point prediction.
A quadratic forecast with changing coefficients
Construction begins with a quadratic time-series projection whose coefficients represent trend velocity and acceleration and are allowed to change rather than stay fixed.
The quadratic forecast is a local polynomial path. Its coefficients stand for estimated price level, velocity, and acceleration at the moment of projection.
Level, velocity, and acceleration are updated recursively with analyst-chosen smoothing constants. Exponential smoothing is recursive weighting of ordered observations that refreshes level, velocity, acceleration, and error variance, giving more influence to recent prints.
Comfort-scaled expected error
Upper and lower bounds are formed by adding and subtracting a comfort-scaled expected-error term from the forecast line.
Expected error is the tracked gap between realized price and the model’s expected outcome. It is used to size the envelope rather than to revise a causal story.
In the illustrated construction, expected error is obtained by exponentially smoothing the squared differences between realized prices and the model’s expected outcomes.
The comfort factor is a risk-tolerance scalar applied to the expected-error estimate. It sets how far the upper and lower bounds sit from the forecast line. A comfort factor of 1 is presented as equivalent to one standard deviation on each side of the forecast, matching a conventional Student t-style interval around the best estimate.
Once coefficients, forecast horizon, and comfort factor are fixed, the channel is applied uniformly by formula. Freehand envelopes are treated as subjective and easily widened by a few large deviations.
Three regions from an envelope exit
Price leaving the envelope is used to mark a break in the assumed trend and to partition the chart into deteriorating, neutral, and improving regions.
The deteriorating region is the area below the lower bound, read as evidence that the assumed trend has weakened. The neutral region is the interior of the channel, read as consistent with continuation of the estimated trend. The improving region is the area above the upper bound, read as evidence that price is outrunning the prior trend.
Contrast with a moving-average cross
The channel and a moving average both generate signals from price crossing a computed line. The channel is designed to extrapolate and to place greater weight on recent observations.
A moving average, in this comparison, is a non-extrapolating average of past prices used as a baseline for crossing rules.
Editorial: the anticipatory three-zone channel is the object offered for checking. The moving-average cross does not extrapolate.
When the smoother is a poor fit
The quadratic smoother is described as unsuitable while a security is building a base, or while trend change is so small that the channel merely tracks price.
A worked daily initialization
A worked daily example initializes the smoothing constants and the error-smoothing constant at 0.5 and the comfort factor at 1. It then forms the next day’s bounds from a one-step forecast plus or minus the comfort-scaled error term.
DJIA one-step Holt-Winter channel, January 1988
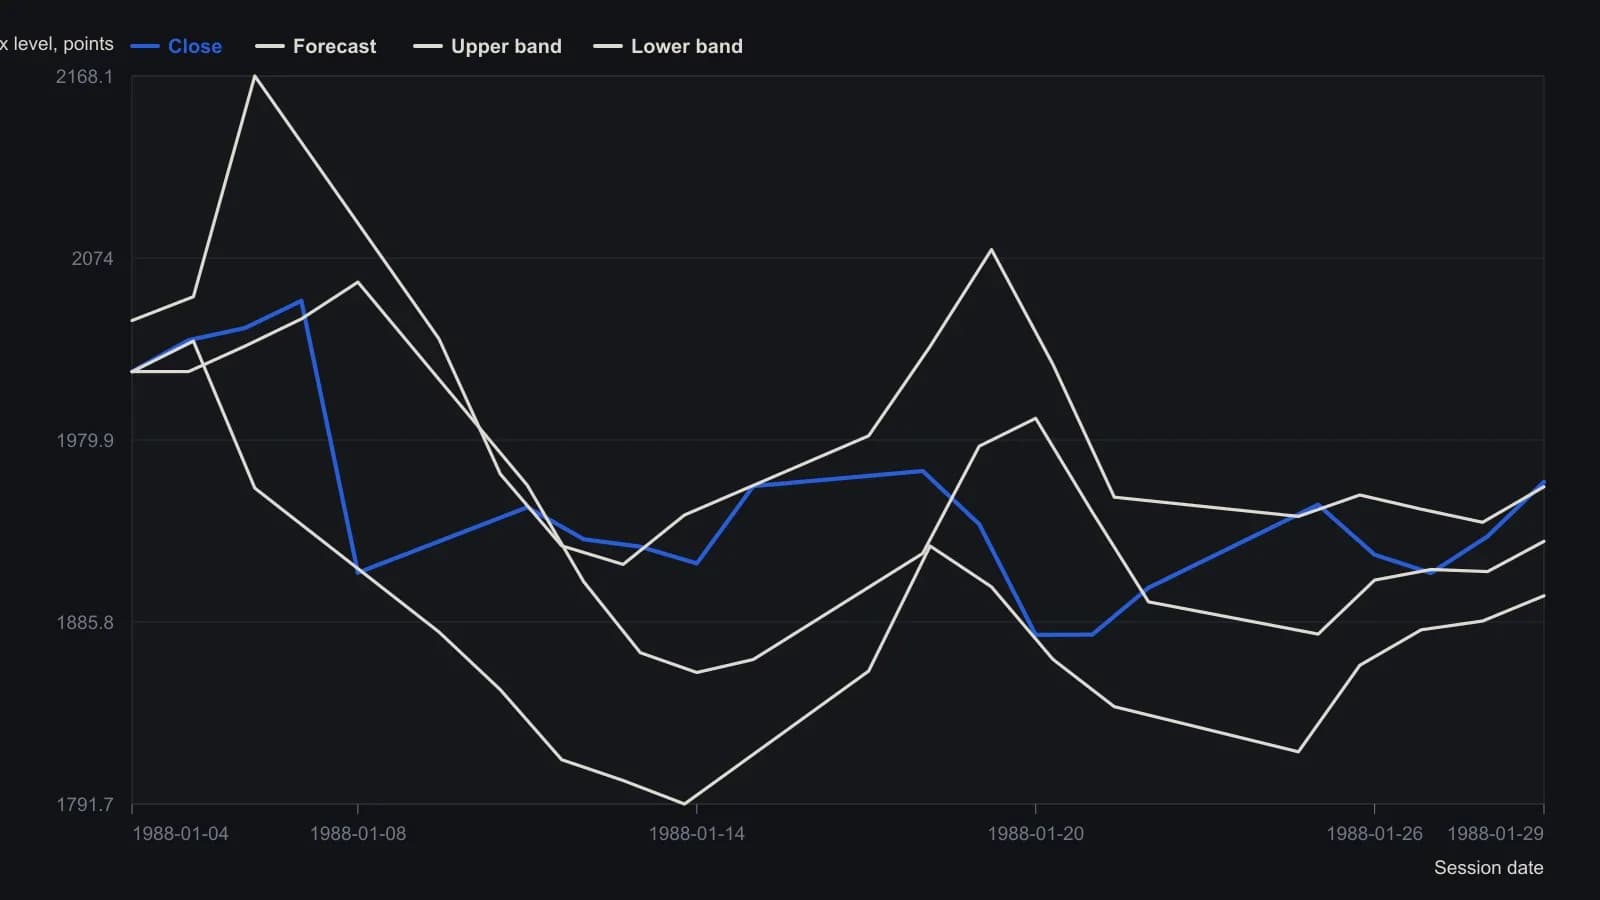
The source fixes smoothing weights a, b, c and d at 0.5 and a comfort factor of 1, and it projects only one trading day ahead. Upper and lower bands are not printed until the third session, once a variance estimate exists.
All readings on this track · 55 readings
- 1988Constructing price channels from trendlines
- 1988Three-point curved trend channel construction
- 1988Least-squares construction of channel trendlines
- 1988Three-zone price channel from quadratic smoothing
- 1989A variable-sensitivity stochastic built on three-sigma bounds
- 1989Close-minus-average oscillator for channel extremes
- 1989The six-stage hunt as a critique of one-click heroics
- 1990Fair-value gaps and a copper moving-average channel
- 1990Diversify markets, not systems, to cut trend-system variance
- 1991Constructing trendlines, price channels, and close-based breakouts
- 1991Constructing seasonal-cycle overlays with channel confirmation
- 1993Lag-compensated exponential trend channel construction
- 1993Constructing a lead-lag filter and price channel as one stack
- 1993Three stochastic warnings still need price-channel confirmation
- 1993Lead-lag smoothing for weekly trend-channel construction
- 1993Constructing zero-net-lag price channels
- 1995From a downtrend-line break to a regression channel
- 1995Validated trendline and price channel construction
- 1995Constructing price envelopes from averages, volatility, and regression
- 1996Constructing trendlines and channels from explicit swings
- 1998Fifty percent retracement as a channel regime test
- 1998Close-based channel rails as daily scenario maps
- 1999Constructing support, resistance, trendlines, and price channels
- 2001Cycle composites, price channels, and two-sided signals
- 2001Testing horizontal price channels with stops and scale
- 2002A two-stage momentum-shift and price-channel process
- 2002Wave-by-wave channel construction for Elliott counts
- 2002Affine channels as reusable trade hypotheses
- 2004Stress-test seasonal windows across regimes, then add channels
- 2004Regime permission from trendlines, channels, and range edges
- 2004Weekly-average and price-channel states on sector depositary baskets
- 2005Oil services catch-up after channel resistance breaks
- 2005Constructing a volatility-normalized cycle index
- 2005How a Darvas channel becomes a complete entry and exit procedure
- 2005Clustered Fibonacci and channel levels in news-driven forex
- 2005Treat a consolidating currency market as a time-frame problem
- 2005Channel walls that flip roles or recapture price
- 2006Stacking candlesticks, crossovers, and price channels
- 2006Failed uptrend channel breakout left the euro rangebound
- 2006Constructing a Wilson relative price channel from a range-bound strength index
- 2007Range bars change when a Bollinger squeeze counts as a breakout
- 2009One testable SPY procedure for a price channel, a trend rule, and a seasonal overlay
- 2010A gold-miner channel plan from value to false breakouts
- 2010A multi-timeframe channel from value to an overvalued zone
- 2010Asymmetric price channel construction for congested markets
- 2011Phasing many cycles at once with nested envelopes
- 2012Constructing adaptive horizontal price channels
- 2014Confirming support with trendlines, channels, and retracements
- 2015News-sentiment confirmation for support, channel, and volume tests
- 2015A three-layer permission stack: moving averages, a price channel, and weekly levels
- 2016Entropy-diff as a regime switch between trend following and a price channel
- 2017Competing rulers on a pound chart after Brexit
- 2017Test consolidation channel breakouts as one procedure
- 2020Constructing late-trend longs with a price channel, gap breakout, and trailing stop
- 2025Using IBM's multi-year price channel as a breakout teaching case