2010issue C0170-72
A gold-miner channel plan from value to false breakouts
A weekend intermarket scan produced a long-gold view expressed through IAMGOLD. The archive then records a written buy zone, while the review chart locates value between moving averages, treats a failed downside break as the buy signal, and treats a later failed upside break as the exit cue.
- A weekend intermarket scan that was bearish on the US dollar and government bonds and bullish on gold was expressed through gold-mining shares.
- IAMGOLD was treated as holding support near its 50-day moving average, with weekly and daily impulse readings used only as a buy-permission filter.
- A Friday low that undercut the prior Friday low by three cents and then reversed was the false downside breakout used as the buy signal.
- A Thursday probe that broke the Tuesday high and closed back below resistance was the false upside breakout treated as a cue to take profits.
From a scan to a written plan
A weekend intermarket scan showed bearish setups in the US dollar and government bonds alongside a bullish setup in gold. That combination led the trader to express a long-gold view through gold-mining shares.
Editorial reading: the scan supplied a directional bias only. The idea became a falsifiable plan once a buy zone, a stop, a target, and a reward-to-risk figure were written down, and once the review chart specified a price-channel with false-breakout rules.
Permission and the first value line
IAMGOLD was treated as holding support near its 50-day moving average at $12.50. A moving-average is a trailing average of recent closes used as a support or value reference and as one boundary of the value zone.
Weekly and daily impulse readings permitted a buy. The impulse-system is a permission filter that allows buying only when weekly and daily impulse readings are not in a sell color.
Editorial note: permission to buy is not an entry signal. The impulse-system only cleared the way. The written zone set the live order, and the review chart later named the false downside break as the buy signal.
The live plan and the fill
The initial plan was to buy between $13 and $13.50, stop at $12.30, and target $15.50. Reward-to-risk is the planned target distance divided by the planned stop distance. Here it was stated as 3.6:1 and used to judge whether the setup was worth taking.
The position was opened Monday at $13.38. After the stock approached the first target, the target was raised. An unattended Friday stop at the daily pivot exited the trade at $14.69.
How the review chart framed the channel
The review chart framed a steady uptrend whose periodic selloffs ended just below a value zone defined by two moving averages. Swings toward an upper channel line were treated as the overvalued side.
A price-channel is a band around value, often marked by moving averages and an upper channel line, used to frame swings from an undervalued zone to an overvalued zone.
IAG daily: value between MAs, then the late-September rally
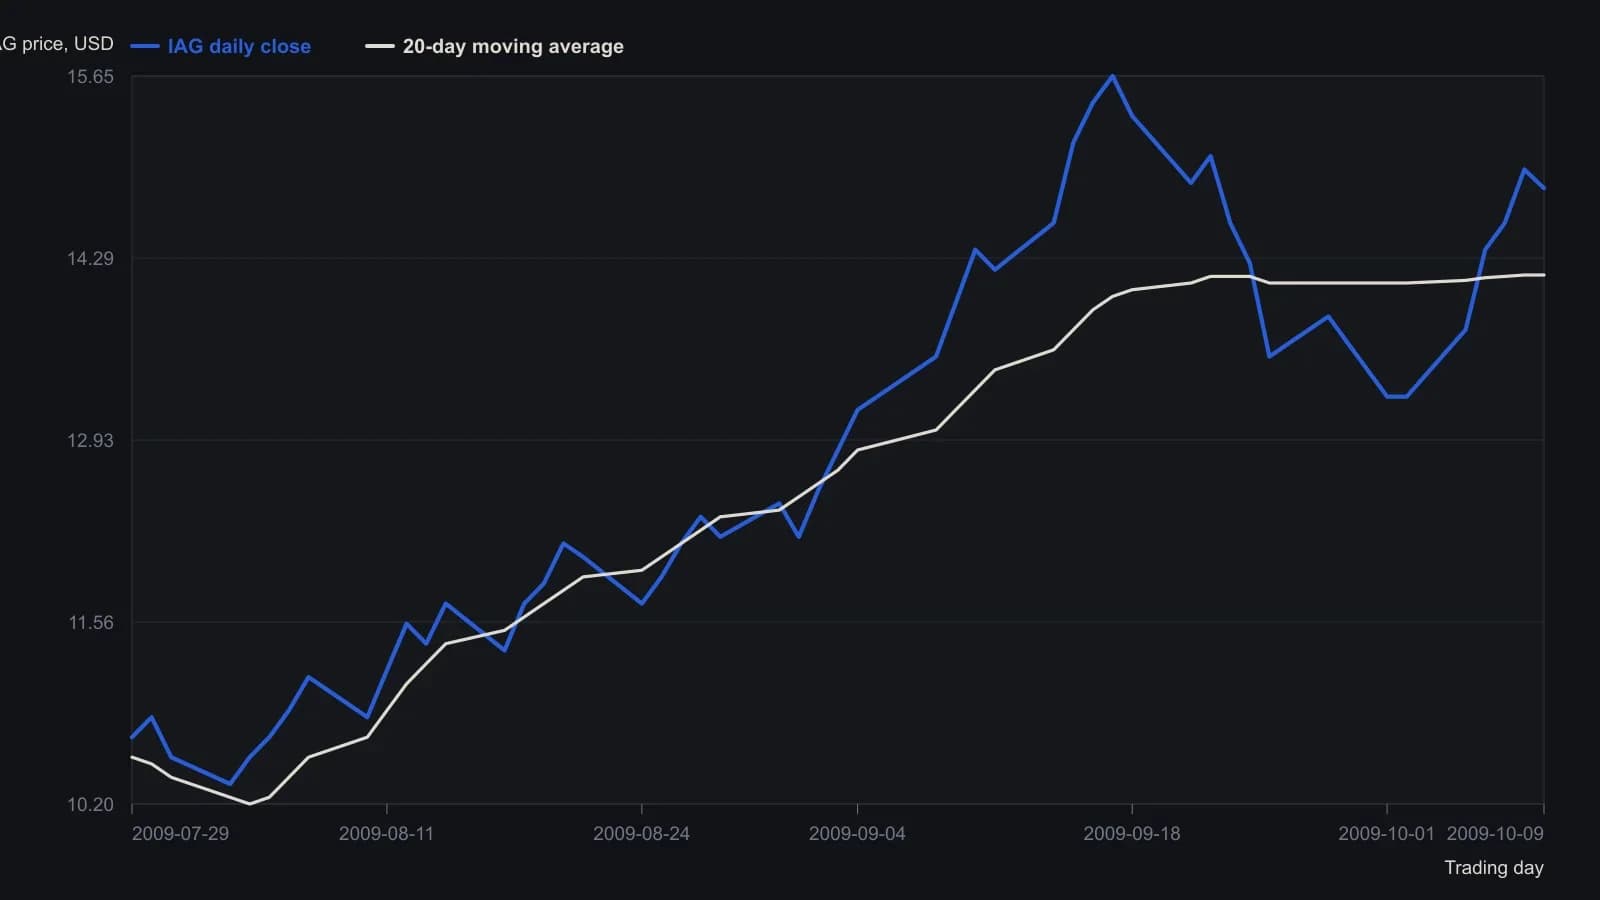
Digitized from the daily candlestick pane. Envelope ENV(20,20,0) ran about 11.33–16.93 and MA(20) was 14.16 on the snapshot date; volume is omitted. No more than one close per trading day is plotted, and y-values are rounded to the nearest 0.05 because the raster cannot support tighter precision.
False breakouts as the review signals
A Friday low of $12.64 undercut the prior Friday low of $12.67 by three cents and then reversed. That sequence completed a false downside breakout and was used as a buy signal.
On Thursday the stock broke 17 cents above its Tuesday high of $15.03 but failed to hold that level and closed back below resistance. That failure was treated as a false upside breakout and a cue to take profits.
A breakout is a probe beyond a recent high or low that is confirmed only if price holds the new side. A brief pierce that reverses is treated as a false breakout.
Editorial note: the live book was closed by the unattended Friday pivot stop. The false upside breakout is the review chart's profit cue, not the order that ended the position. The written buy zone and the later false-breakout reading should not be collapsed into one planned rule.
All readings on this track · 55 readings
- 1988Constructing price channels from trendlines
- 1988Three-point curved trend channel construction
- 1988Least-squares construction of channel trendlines
- 1988Three-zone price channel from quadratic smoothing
- 1989A variable-sensitivity stochastic built on three-sigma bounds
- 1989Close-minus-average oscillator for channel extremes
- 1989The six-stage hunt as a critique of one-click heroics
- 1990Fair-value gaps and a copper moving-average channel
- 1990Diversify markets, not systems, to cut trend-system variance
- 1991Constructing trendlines, price channels, and close-based breakouts
- 1991Constructing seasonal-cycle overlays with channel confirmation
- 1993Lag-compensated exponential trend channel construction
- 1993Constructing a lead-lag filter and price channel as one stack
- 1993Three stochastic warnings still need price-channel confirmation
- 1993Lead-lag smoothing for weekly trend-channel construction
- 1993Constructing zero-net-lag price channels
- 1995From a downtrend-line break to a regression channel
- 1995Validated trendline and price channel construction
- 1995Constructing price envelopes from averages, volatility, and regression
- 1996Constructing trendlines and channels from explicit swings
- 1998Fifty percent retracement as a channel regime test
- 1998Close-based channel rails as daily scenario maps
- 1999Constructing support, resistance, trendlines, and price channels
- 2001Cycle composites, price channels, and two-sided signals
- 2001Testing horizontal price channels with stops and scale
- 2002A two-stage momentum-shift and price-channel process
- 2002Wave-by-wave channel construction for Elliott counts
- 2002Affine channels as reusable trade hypotheses
- 2004Stress-test seasonal windows across regimes, then add channels
- 2004Regime permission from trendlines, channels, and range edges
- 2004Weekly-average and price-channel states on sector depositary baskets
- 2005Oil services catch-up after channel resistance breaks
- 2005Constructing a volatility-normalized cycle index
- 2005How a Darvas channel becomes a complete entry and exit procedure
- 2005Clustered Fibonacci and channel levels in news-driven forex
- 2005Treat a consolidating currency market as a time-frame problem
- 2005Channel walls that flip roles or recapture price
- 2006Stacking candlesticks, crossovers, and price channels
- 2006Failed uptrend channel breakout left the euro rangebound
- 2006Constructing a Wilson relative price channel from a range-bound strength index
- 2007Range bars change when a Bollinger squeeze counts as a breakout
- 2009One testable SPY procedure for a price channel, a trend rule, and a seasonal overlay
- 2010A gold-miner channel plan from value to false breakouts
- 2010A multi-timeframe channel from value to an overvalued zone
- 2010Asymmetric price channel construction for congested markets
- 2011Phasing many cycles at once with nested envelopes
- 2012Constructing adaptive horizontal price channels
- 2014Confirming support with trendlines, channels, and retracements
- 2015News-sentiment confirmation for support, channel, and volume tests
- 2015A three-layer permission stack: moving averages, a price channel, and weekly levels
- 2016Entropy-diff as a regime switch between trend following and a price channel
- 2017Competing rulers on a pound chart after Brexit
- 2017Test consolidation channel breakouts as one procedure
- 2020Constructing late-trend longs with a price channel, gap breakout, and trailing stop
- 2025Using IBM's multi-year price channel as a breakout teaching case