1989issue C031-10
A variable-sensitivity stochastic built on three-sigma bounds
Editorial teaching note. This article treats oscillator construction as a parts swap: replace a lookback high-low range with a three-sigma channel, then treat exponential pre-smoothing as a labeled sensitivity dial. The same study can be rebuilt as a fast crossing meter or as a flattening trend band.
- Construction places sigma-limits three standard deviations above and below a five-observation average after taking the square root of finite-lookback sample variance.
- A percent-K analogue uses the last three-sigma pair as its range, then two further exponential-smoothing steps with a coefficient of 0.35 form the slower lines.
- Sensitivity is the pre-smoothing coefficient applied to the input series before variance, channel, and oscillator calculations, described as useful from 0.05 to 1.0.
- On short lookbacks with moderate pre-smoothing near 0.08, the smoothed stochastic lines were observed to flatten near 70 percent or 30 percent while a trend persisted.
A parts swap, not a new study
This is an editorial teaching frame, not an archive claim. A stochastic oscillator is a range-relative reading that locates the latest observation between two bounds computed over a defined lookback, then smooths that reading into successive lines. The usual bounds are a lookback high and low. The construction below swaps those bounds for a three-sigma channel and keeps the rest of the study in the same parts order.
Exponential smoothing is a one-parameter recurrence that blends the previous output with the current observation. In this workflow it is used twice: first as a sensitivity setting on the input series, then as the smoother that forms the slower stochastic lines.
Place the sigma-limits first
Construction starts from finite-lookback sample variance. The square root of that variance is the standard deviation. Sigma-limits are then placed three standard deviations above and below a five-observation average.
A sigma-limit is a bound placed a fixed number of standard deviations above or below a short average of the lookback sample. After those bounds exist, the latest raw observation can be replaced with a smoothed value whose span is about half the lookback. That substitution was used to make the oscillator approach a steadier reading.
Two readings from the same pair of bounds
A top-side statistical oscillator is defined as the latest value's distance above the lower three-sigma bound divided by its distance below the upper three-sigma bound.
A stochastic percent-K analogue uses the last three-sigma pair as the range. It is 100 times the distance from the lower bound to the latest value, divided by the full distance between the two bounds. The next two stochastic lines are successive exponential smooths of that percent-K reading. Each uses a coefficient of 0.35, chosen by experiment.
Sensitivity is a pre-smoothing coefficient
Sensitivity is the pre-smoothing coefficient applied to the input series before variance, channel, and oscillator calculations. The series is exponentially smoothed first, using the previous output plus alpha times the gap to the current observation. Alpha was described as useful from 0.05 to 1.0.
SASITOP on the Technical Index at 0.05 sensitivity
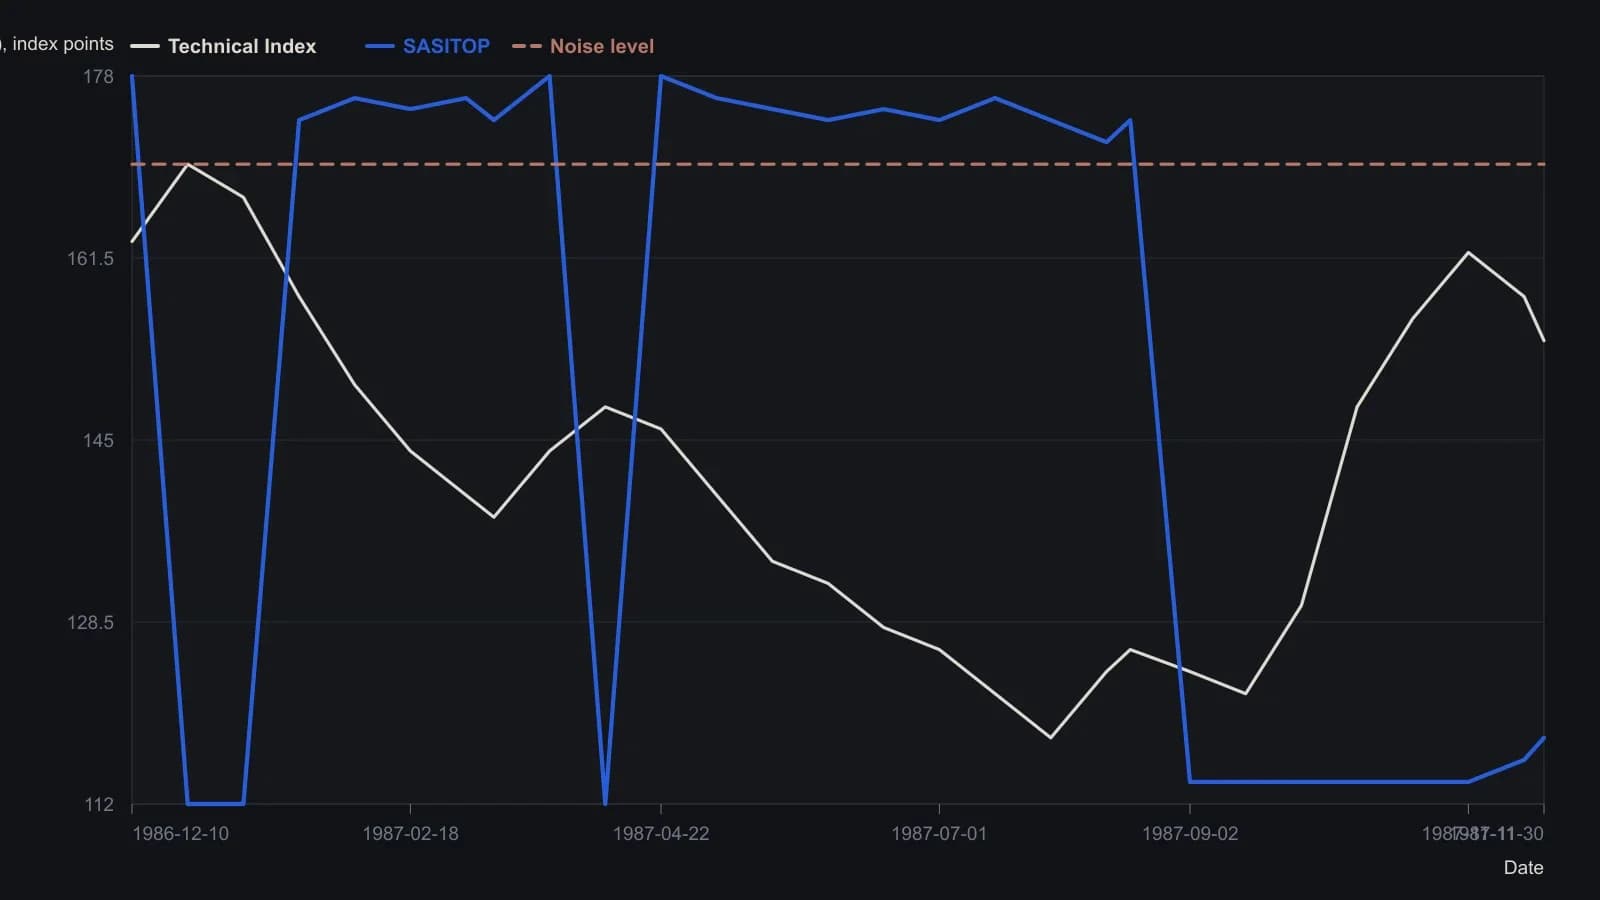
Mason first replaces the usual high-low lookback with plus/minus three-sigma limits around a 5-day average, then pre-smooths the index with exponential alpha 0.05. He also replaces the raw index I with a smoothed Is equal to about half the window. SASITOP is plotted after a vertical scale adjustment so it can share the Technical Index pane. Noise-level exits are the article’s rule, not a statistical table.
A fast meter or a flattening band
Editorial reading: once the range has been swapped, the same sensitivity setting chooses how the study behaves. On short lookbacks with moderate pre-smoothing near 0.08, the smoothed stochastic lines were observed to flatten near 70 percent or 30 percent while a trend persisted. Windows of five or six days were described as best for that flattening.
Raising the pre-smoothing coefficient to 0.10 or higher was described as increasing reactions to minor pinches rather than only larger contractions. Editorial reading: a lower sensitivity setting favors the flattening band, while a higher setting makes the study react more like a fast crossing meter.
The same bounds as a price channel
A price channel, in this construction, is a pair of moving statistical bounds around a smoothed series that stay roughly parallel in a trend and contract when variation pinches. Plotted around the pre-smoothed series, the same three-sigma bounds act as that moving channel. They stay roughly parallel in a trend and pinch when variation contracts around a larger directional move.
All readings on this track · 55 readings
- 1988Constructing price channels from trendlines
- 1988Three-point curved trend channel construction
- 1988Least-squares construction of channel trendlines
- 1988Three-zone price channel from quadratic smoothing
- 1989A variable-sensitivity stochastic built on three-sigma bounds
- 1989Close-minus-average oscillator for channel extremes
- 1989The six-stage hunt as a critique of one-click heroics
- 1990Fair-value gaps and a copper moving-average channel
- 1990Diversify markets, not systems, to cut trend-system variance
- 1991Constructing trendlines, price channels, and close-based breakouts
- 1991Constructing seasonal-cycle overlays with channel confirmation
- 1993Lag-compensated exponential trend channel construction
- 1993Constructing a lead-lag filter and price channel as one stack
- 1993Three stochastic warnings still need price-channel confirmation
- 1993Lead-lag smoothing for weekly trend-channel construction
- 1993Constructing zero-net-lag price channels
- 1995From a downtrend-line break to a regression channel
- 1995Validated trendline and price channel construction
- 1995Constructing price envelopes from averages, volatility, and regression
- 1996Constructing trendlines and channels from explicit swings
- 1998Fifty percent retracement as a channel regime test
- 1998Close-based channel rails as daily scenario maps
- 1999Constructing support, resistance, trendlines, and price channels
- 2001Cycle composites, price channels, and two-sided signals
- 2001Testing horizontal price channels with stops and scale
- 2002A two-stage momentum-shift and price-channel process
- 2002Wave-by-wave channel construction for Elliott counts
- 2002Affine channels as reusable trade hypotheses
- 2004Stress-test seasonal windows across regimes, then add channels
- 2004Regime permission from trendlines, channels, and range edges
- 2004Weekly-average and price-channel states on sector depositary baskets
- 2005Oil services catch-up after channel resistance breaks
- 2005Constructing a volatility-normalized cycle index
- 2005How a Darvas channel becomes a complete entry and exit procedure
- 2005Clustered Fibonacci and channel levels in news-driven forex
- 2005Treat a consolidating currency market as a time-frame problem
- 2005Channel walls that flip roles or recapture price
- 2006Stacking candlesticks, crossovers, and price channels
- 2006Failed uptrend channel breakout left the euro rangebound
- 2006Constructing a Wilson relative price channel from a range-bound strength index
- 2007Range bars change when a Bollinger squeeze counts as a breakout
- 2009One testable SPY procedure for a price channel, a trend rule, and a seasonal overlay
- 2010A gold-miner channel plan from value to false breakouts
- 2010A multi-timeframe channel from value to an overvalued zone
- 2010Asymmetric price channel construction for congested markets
- 2011Phasing many cycles at once with nested envelopes
- 2012Constructing adaptive horizontal price channels
- 2014Confirming support with trendlines, channels, and retracements
- 2015News-sentiment confirmation for support, channel, and volume tests
- 2015A three-layer permission stack: moving averages, a price channel, and weekly levels
- 2016Entropy-diff as a regime switch between trend following and a price channel
- 2017Competing rulers on a pound chart after Brexit
- 2017Test consolidation channel breakouts as one procedure
- 2020Constructing late-trend longs with a price channel, gap breakout, and trailing stop
- 2025Using IBM's multi-year price channel as a breakout teaching case