2005issue C051-7
Constructing a volatility-normalized cycle index
A normalized cycle index freezes one nested moving-average oscillator and divides it by a dynamic volatility unit so the same geometry can be read on any bar interval. Centered estimates and a twin price channel stay in the lab only to make lag visible.
- Nested cycle periods of 25, 50, and 100 bars each set a trend-phase interval to half the period, then scale a moving-average difference into a normalized cycle index.
- A dynamic volatility unit, the standard deviation of minor and subminor oscillations around a centered minor-term average, supplies the one-sigma scale and the 50 percent and 100 percent bands.
- Centered estimates insert a half-cycle of later bars and are withheld from live use so they can sit beside the real-time series and an unshifted price channel as a lag benchmark.
- The same 25-bar construction is applied to daily, five-minute, and weekly bars, because longer live cycle series miss extremes and crossings more than the short-horizon index.
What is held fixed
A reference cycle index is built as a volatility-normalized moving-average convergence/divergence series. Nested cycle periods of 25, 50, and 100 bars each receive a trend-phase interval equal to half of that period.
Editorial reading: treat the setup as a construction lab rather than an indicator contest. One nested half-period oscillator stays frozen, its bands stay pinned to a live volatility unit, and a two-sigma price channel sits beside a centered twin so bar length and lag are the only variables under test.
The dynamic volatility unit
The oscillator is divided by a dynamic volatility unit. That unit is the standard deviation of minor and subminor oscillations around a minor-term centered moving average, and it is the one-sigma scale of the normalized cycle index.
Minor-cycle bands sit at plus or minus 50 percent of the dynamic volatility unit. Plus or minus 100 percent is treated as a two-sigma, 95 percent envelope for price action.
Centered estimates as a lag benchmark
A centered estimate inserts a half-cycle of later data, which is 12 bars at the minor horizon. It is withheld from live use so it can serve only as a lag benchmark against the real-time series.
The trend-phase interval is used both as phase-line spacing and as the lag of a centered average.
Twin price channels
A price channel is drawn around a 25-bar average at plus or minus two volatility units. The centered channel uses that average shifted forward by 12 bars. The real-time channel uses the unshifted average.
On the illustrated 100-bar daily sample, the centered two-sigma channel left out about five bars, while the real-time channel showed the displacement produced by lag.
Same geometry on other oscillators
A 12-bar relative-strength oscillator and a 12-bar stochastic oscillator, once scaled and normalized the same way, match the minor-term cycle index in amplitude, phase, and local shape. That match is consistent with the index being a difference of exponential moving averages whose crossings align with oscillator crossings.
A baseline test harness
A baseline test harness marks a candidate reversal when the index reaches or exceeds a 50 percent band and then recrosses it. A stop is added when an open loss is on the order of the displayed one-sigma range.
A continuation mark that appears after a stop is read as a two-way re-entry candidate until an opposite reversal appears inside the same trade sequence.
VeriSign daily minor-cycle index, February–July 2003
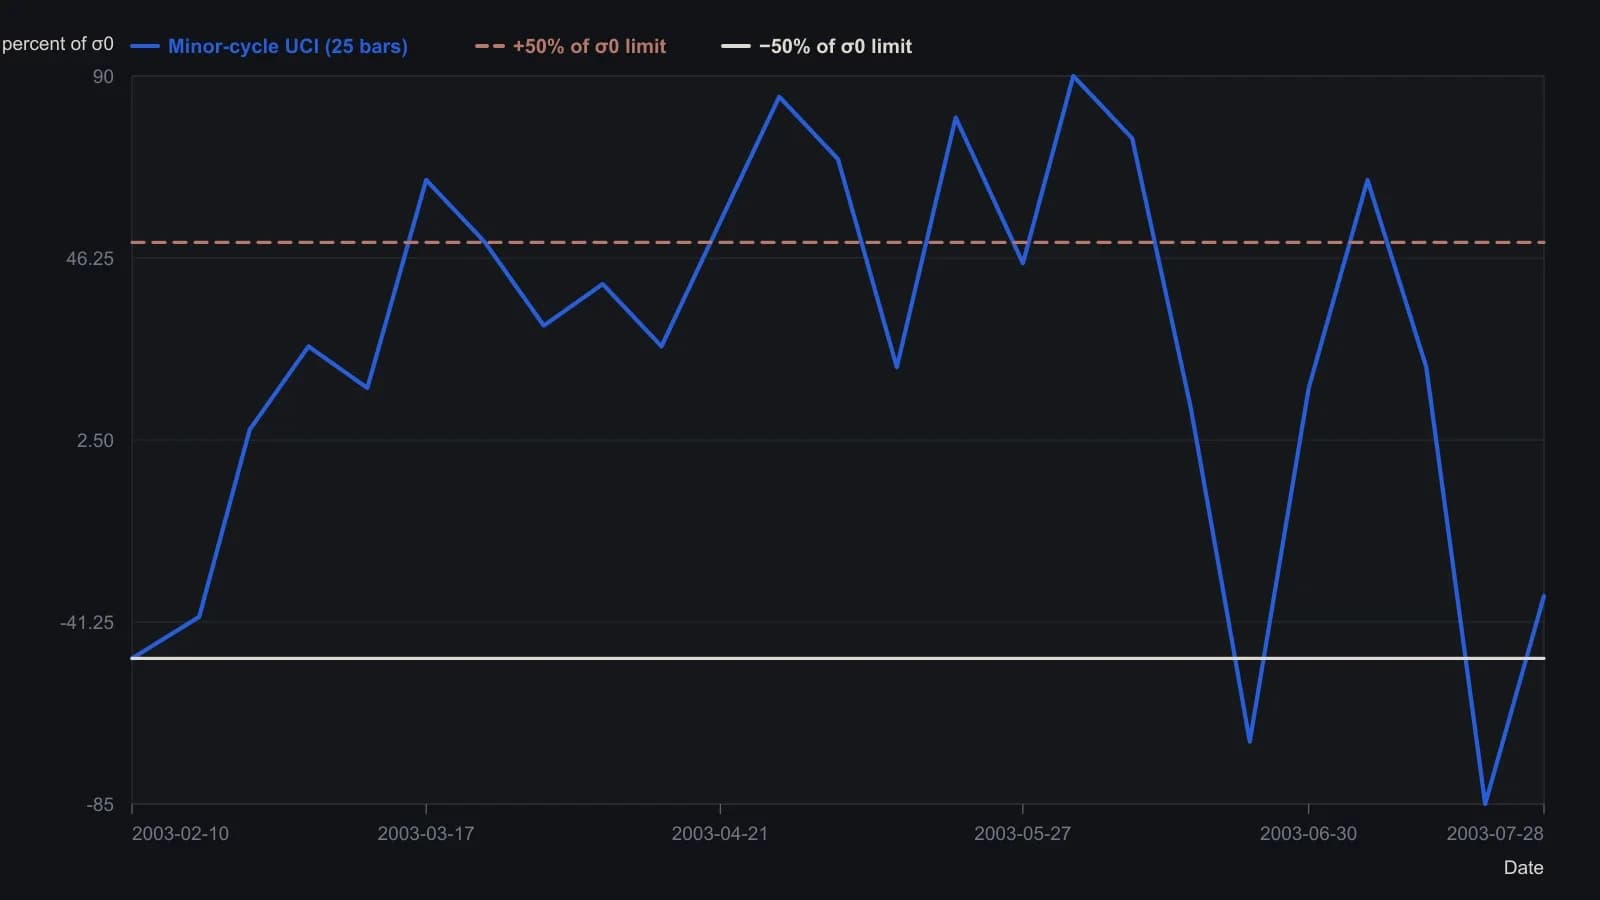
UCI is a 6/12 EMA MACD scaled as 100 times the spread over dynamic σ0 (sigom), with minor period TM = 25 bars. Centered twins are not on this pane. Raster reading is only good to about ±5 index points.
One construction across bar intervals
The same 25-bar minor period, 12-bar phase interval, and volatility-normalized construction is applied to daily, five-minute, and weekly bars rather than inventing a new oscillator for each horizon.
Compared with their centered counterparts, the 50-bar and 100-bar cycle series miss extremes and crossings more than the 25-bar series. The construction therefore prefers applying the short-horizon index to coarser bars instead of projecting a live oscillator further ahead.
All readings on this track · 55 readings
- 1988Constructing price channels from trendlines
- 1988Three-point curved trend channel construction
- 1988Least-squares construction of channel trendlines
- 1988Three-zone price channel from quadratic smoothing
- 1989A variable-sensitivity stochastic built on three-sigma bounds
- 1989Close-minus-average oscillator for channel extremes
- 1989The six-stage hunt as a critique of one-click heroics
- 1990Fair-value gaps and a copper moving-average channel
- 1990Diversify markets, not systems, to cut trend-system variance
- 1991Constructing trendlines, price channels, and close-based breakouts
- 1991Constructing seasonal-cycle overlays with channel confirmation
- 1993Lag-compensated exponential trend channel construction
- 1993Constructing a lead-lag filter and price channel as one stack
- 1993Three stochastic warnings still need price-channel confirmation
- 1993Lead-lag smoothing for weekly trend-channel construction
- 1993Constructing zero-net-lag price channels
- 1995From a downtrend-line break to a regression channel
- 1995Validated trendline and price channel construction
- 1995Constructing price envelopes from averages, volatility, and regression
- 1996Constructing trendlines and channels from explicit swings
- 1998Fifty percent retracement as a channel regime test
- 1998Close-based channel rails as daily scenario maps
- 1999Constructing support, resistance, trendlines, and price channels
- 2001Cycle composites, price channels, and two-sided signals
- 2001Testing horizontal price channels with stops and scale
- 2002A two-stage momentum-shift and price-channel process
- 2002Wave-by-wave channel construction for Elliott counts
- 2002Affine channels as reusable trade hypotheses
- 2004Stress-test seasonal windows across regimes, then add channels
- 2004Regime permission from trendlines, channels, and range edges
- 2004Weekly-average and price-channel states on sector depositary baskets
- 2005Oil services catch-up after channel resistance breaks
- 2005Constructing a volatility-normalized cycle index
- 2005How a Darvas channel becomes a complete entry and exit procedure
- 2005Clustered Fibonacci and channel levels in news-driven forex
- 2005Treat a consolidating currency market as a time-frame problem
- 2005Channel walls that flip roles or recapture price
- 2006Stacking candlesticks, crossovers, and price channels
- 2006Failed uptrend channel breakout left the euro rangebound
- 2006Constructing a Wilson relative price channel from a range-bound strength index
- 2007Range bars change when a Bollinger squeeze counts as a breakout
- 2009One testable SPY procedure for a price channel, a trend rule, and a seasonal overlay
- 2010A gold-miner channel plan from value to false breakouts
- 2010A multi-timeframe channel from value to an overvalued zone
- 2010Asymmetric price channel construction for congested markets
- 2011Phasing many cycles at once with nested envelopes
- 2012Constructing adaptive horizontal price channels
- 2014Confirming support with trendlines, channels, and retracements
- 2015News-sentiment confirmation for support, channel, and volume tests
- 2015A three-layer permission stack: moving averages, a price channel, and weekly levels
- 2016Entropy-diff as a regime switch between trend following and a price channel
- 2017Competing rulers on a pound chart after Brexit
- 2017Test consolidation channel breakouts as one procedure
- 2020Constructing late-trend longs with a price channel, gap breakout, and trailing stop
- 2025Using IBM's multi-year price channel as a breakout teaching case