2001issue C151-2
Testing horizontal price channels with stops and scale
Editorial view: treat a sideways price channel as a draft hypothesis, not a finished signal. The archive workflow asked for chart scale that made the walls coherent, an upswing off support, a stop-loss under that floor, an exit at resistance, and a liquidity filter that the range could actually be traded.
- Finding a horizontal channel was a visual search for repeated highs and lows, not a concealed formula, and favored names that had already printed peaks usable as resistance.
- The same support and resistance lines looked doubtful on a one-year chart and more consistent on a three-year chart.
- A channel long waited for upswing confirmation, used a stop-loss under support, and treated resistance as the planned exit.
- The liquidity filter used about 10% volatility, typical volume of 50,000 shares or more unless the bid-ask spread was only a small part of the range, and still did not guarantee a fill.
Treat the channel as a hypothesis
Editorial reading: a sideways price channel is a draft hypothesis, not a finished signal. The same walls can look false on a short chart and coherent on a longer one.
In the archive, a long was described as live only after an upswing had started from support, a stop-loss sat under that floor, the planned exit was at resistance, and a liquidity filter suggested the range could actually be traded.
A visual search, not a hidden formula
The process for finding stocks in a horizontal channel was described as a visual search for chart patterns rather than a concealed formula.
Channel construction favored names that had already printed one or more peaks that could serve as resistance. Those prior peaks and troughs were the support and resistance structure: a floor, an alternative floor, or a ceiling that could mark entry, invalidation, or a planned exit.
Chart scale can change the picture
Chart scale is the lookback window used to judge whether the same support and resistance lines form a coherent channel.
On one worked idea, a one-year view made the same horizontal channel look doubtful, while a three-year chart made those support and resistance lines look more consistent.
Confirmation, stop-loss, and a planned exit
The stated long process was to confirm that an upswing had started, use a protective stop-loss, and exit when resistance was expected. Upswing confirmation meant waiting until price had started rising from the lower boundary before treating a channel long as active.
The stop-loss was a predefined protective exit placed below chosen support so a failed channel long stayed bounded.
On one worked chart, reconstructed support sat near 6.50 or 6.75, the stop-loss at 6.25, and resistance as the long exit at 8.00.
The liquidity filter
The liquidity filter checked that volatility, typical volume, and the bid-ask spread fit the width of the support-resistance range.
Stated screens included about 10% volatility to span that range and typical volume of 50,000 shares or more. When the bid-ask spread was only a small part of the support-resistance range, typical volume was allowed to fall below 50,000 shares.
A spread check did not guarantee liquidity. Filling the intended size in one example implied buying close to 1,000 shares.
How often the rules left a long in place
Using those confirmation rules, a reviewer would have been long on only two of the first twelve names examined.
In a later set of twelve channel ideas, two had turned down, nine were still sideways, and one had gapped up.
Franklin Covey three-year daily close versus the $8.00 / $6.75 channel
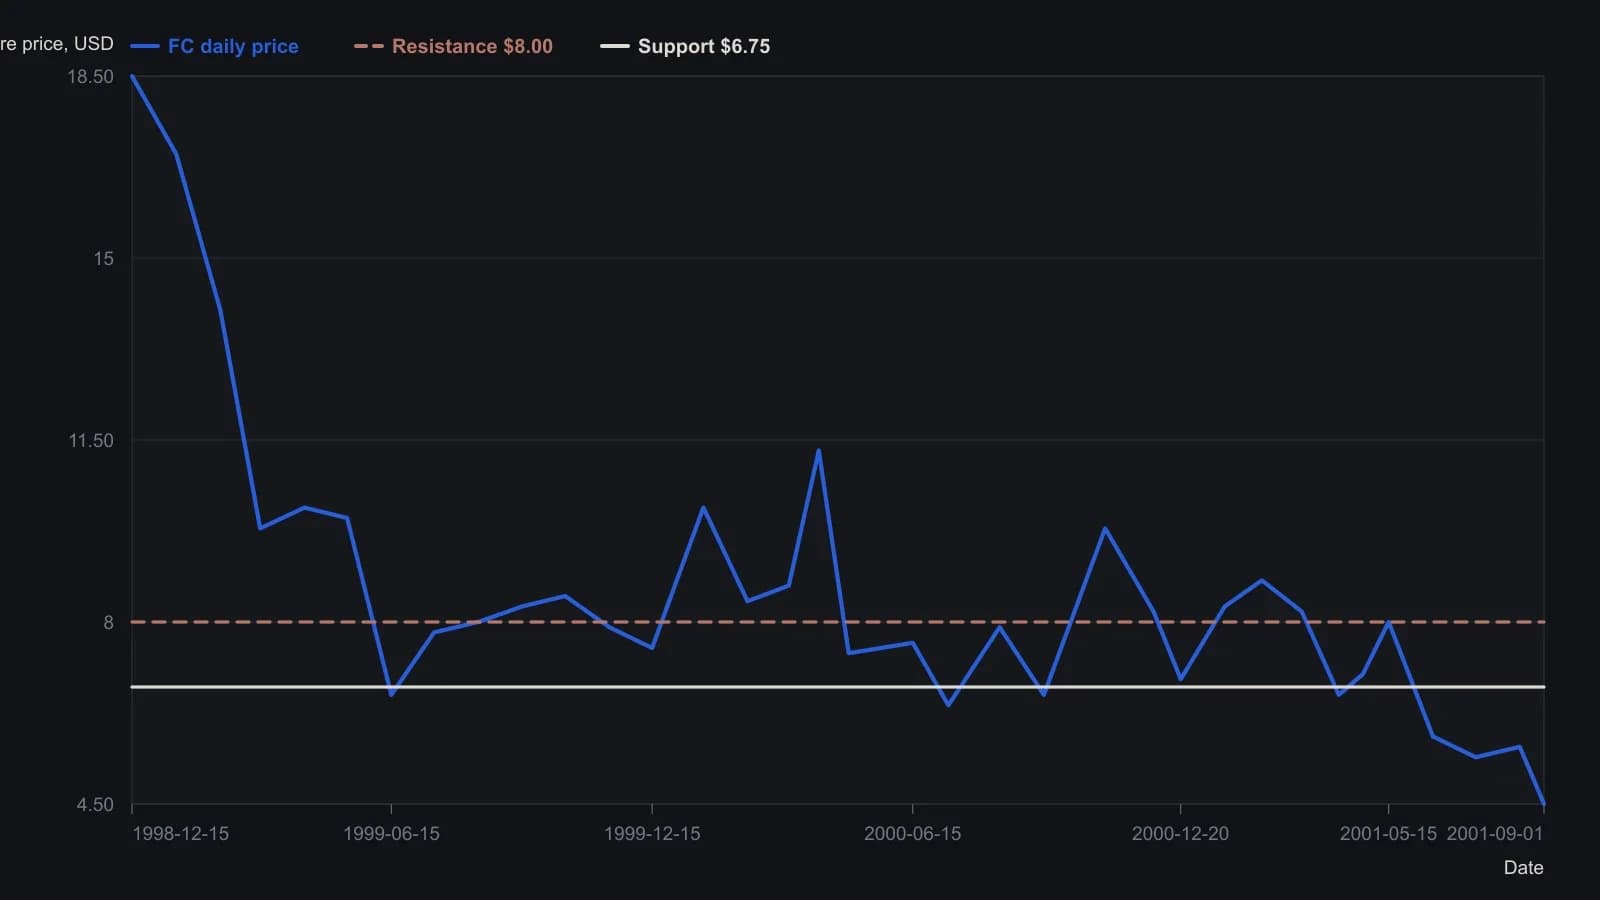
Closes are approximate readings from the printed daily chart, so turning points are rounded to the nearest tenth of a dollar. Resistance at $8.00 and support at $6.75 are the levels stated in the review, not interpolated from pixels. The source marks 27 April 2001 with a vertical line.
All readings on this track · 55 readings
- 1988Constructing price channels from trendlines
- 1988Three-point curved trend channel construction
- 1988Least-squares construction of channel trendlines
- 1988Three-zone price channel from quadratic smoothing
- 1989A variable-sensitivity stochastic built on three-sigma bounds
- 1989Close-minus-average oscillator for channel extremes
- 1989The six-stage hunt as a critique of one-click heroics
- 1990Fair-value gaps and a copper moving-average channel
- 1990Diversify markets, not systems, to cut trend-system variance
- 1991Constructing trendlines, price channels, and close-based breakouts
- 1991Constructing seasonal-cycle overlays with channel confirmation
- 1993Lag-compensated exponential trend channel construction
- 1993Constructing a lead-lag filter and price channel as one stack
- 1993Three stochastic warnings still need price-channel confirmation
- 1993Lead-lag smoothing for weekly trend-channel construction
- 1993Constructing zero-net-lag price channels
- 1995From a downtrend-line break to a regression channel
- 1995Validated trendline and price channel construction
- 1995Constructing price envelopes from averages, volatility, and regression
- 1996Constructing trendlines and channels from explicit swings
- 1998Fifty percent retracement as a channel regime test
- 1998Close-based channel rails as daily scenario maps
- 1999Constructing support, resistance, trendlines, and price channels
- 2001Cycle composites, price channels, and two-sided signals
- 2001Testing horizontal price channels with stops and scale
- 2002A two-stage momentum-shift and price-channel process
- 2002Wave-by-wave channel construction for Elliott counts
- 2002Affine channels as reusable trade hypotheses
- 2004Stress-test seasonal windows across regimes, then add channels
- 2004Regime permission from trendlines, channels, and range edges
- 2004Weekly-average and price-channel states on sector depositary baskets
- 2005Oil services catch-up after channel resistance breaks
- 2005Constructing a volatility-normalized cycle index
- 2005How a Darvas channel becomes a complete entry and exit procedure
- 2005Clustered Fibonacci and channel levels in news-driven forex
- 2005Treat a consolidating currency market as a time-frame problem
- 2005Channel walls that flip roles or recapture price
- 2006Stacking candlesticks, crossovers, and price channels
- 2006Failed uptrend channel breakout left the euro rangebound
- 2006Constructing a Wilson relative price channel from a range-bound strength index
- 2007Range bars change when a Bollinger squeeze counts as a breakout
- 2009One testable SPY procedure for a price channel, a trend rule, and a seasonal overlay
- 2010A gold-miner channel plan from value to false breakouts
- 2010A multi-timeframe channel from value to an overvalued zone
- 2010Asymmetric price channel construction for congested markets
- 2011Phasing many cycles at once with nested envelopes
- 2012Constructing adaptive horizontal price channels
- 2014Confirming support with trendlines, channels, and retracements
- 2015News-sentiment confirmation for support, channel, and volume tests
- 2015A three-layer permission stack: moving averages, a price channel, and weekly levels
- 2016Entropy-diff as a regime switch between trend following and a price channel
- 2017Competing rulers on a pound chart after Brexit
- 2017Test consolidation channel breakouts as one procedure
- 2020Constructing late-trend longs with a price channel, gap breakout, and trailing stop
- 2025Using IBM's multi-year price channel as a breakout teaching case