2004issue C081-4
Regime permission from trendlines, channels, and range edges
Classify the tape first with trendlines, channel rails, and nearby support or resistance. Then allow only the holding period and stop style those levels authorize, so the same pattern is not traded with the same rules in every regime.
- A nightly scan of pullbacks, volume accumulation and distribution, and chart patterns is prechecked in bullish, bearish, and sideways periods so the regime read can select which tools to use.
- A written evening review should center on where support and resistance sit and what those levels imply, not on adopting a bullish or bearish stance.
- Pattern families can stay similar in a trend or a range. The market-regime chooses the stop and holding rules.
- Taking every signal from one system without a regime filter is described as producing frequent stop-outs.
The archive workflow classifies the tape before a trade plan is allowed to run. Trendlines, channel rails, and nearby support or resistance are read first. Only the holding period and stop style those levels authorize are then used.
The TradersWeek editorial reading treats that order as a permission layer. A market-regime is the current tape state, trending, range-bound, or transitional after a line break, that selects which holding period and stop style may be used. That framing is editorial and is not attributed to the archive.
Scan the tape in every regime
A nightly scan set covering long and short pullbacks, volume accumulation and distribution, and chart patterns is prechecked in bullish, bearish, and sideways periods so the regime read can select which tools to use. Short-term, intermediate-term, and longer-horizon rule sets are all maintained, and the current regime selects which set is active.
Write the evening review around the levels
A written evening review of current conditions is recommended. It is centered on where support and resistance sit and what those levels imply, rather than on adopting a bullish or bearish stance.
Use trendlines as a directional filter
A trendline is a line through successive highs or lows used as a regime filter. Staying on one side keeps the matching directional playbook. A break pauses that playbook until new swing structure forms.
Index trendlines and a 30-day simple average on a Nasdaq proxy are used as filters. New longs are restricted to periods when that proxy is above the average. Nasdaq trendlines are used to emphasize long versus short swing setups. In the illustrated Nasdaq stretch, short swing setups are favored while price remains under a descending trendline, and attention shifts toward long swing setups after that line breaks.
Pause a playbook after a break
After a rising trendline breaks, new long entries are halted. New short swing trades wait for a lower low after the break. If a later pullback does not make a lower low, the rising line is redrawn through that low and reused as a filter on further long entries.
Nasdaq Composite, 2000–2003, with moving-average overlay
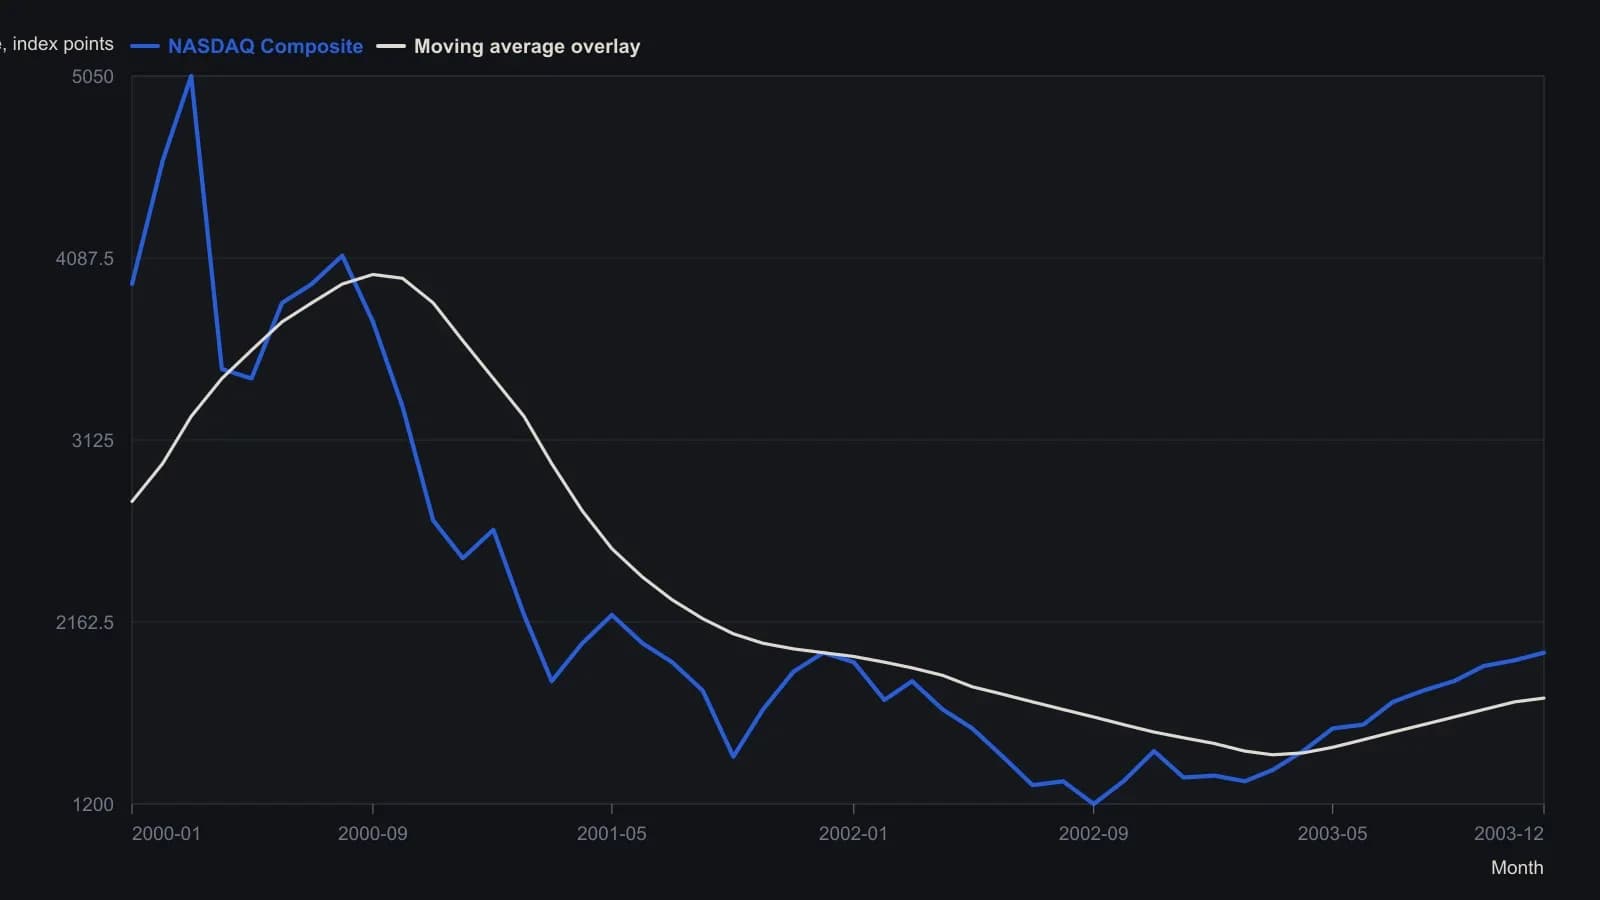
Monthly samples digitized from the magazine raster (AIQ weekly/daily bars). Y-axis ticks are 256 index points; readings are to the nearest ~50 points. The printed cursor on the source pane is 13 Oct 2000 at 3705. The moving-average length is not stated on the figure; the article separately cites a 30-day simple average on QQQ as an entry filter.
Match holding rules to the regime
A clear trend is paired with swing or intermediate-term tactics. A range-bound tape is paired with short-term or swing tactics. Pattern families stay similar across those states, but the regime chooses the stop and holding rules.
Short-term trades target the breakout window and are exited after one to three days or after a move of $1.50 or 4 percent. Short-term swing and intermediate-term trades both start with a stop under the setup-pattern low. The intermediate-term trade stays open while conditions remain favorable and is sold when the stock or the market breaks a key trendline or shows topping behavior.
Intermediate-term rules wait for a clear trend, typically a higher low after a trendline break or a successful retest of a base breakout. That higher-low-confirmation after a descending-line break is what makes an uptrend clear enough to justify intermediate-term rules. Until that higher low forms, only short-term or swing rules apply.
Read range edges as bounce or break points
Support and resistance are prior swing highs and lows that mark range edges, bounce-or-break decision points, and fail-safe exits if a bounce or breakout is rejected.
At range support, a bounce off a retested low is treated as a candidate long that is canceled if price falls below the support of the prior four bars. Near range resistance, short-term longs are closed and the next plan is either a short if price turns down or a long if resistance gives way. A breakout from a base is treated as a cue to shift from short-term rules toward swing or intermediate-term rules, with a quick exit if price falls back into the base.
Let a channel keep two horizons in play
A price channel is parallel rails around a trend that let short-horizon fades at the far boundary coexist with intermediate-horizon holds while the channel remains intact. In a rising channel, longs near the lower rail and shorts near the upper rail may run alongside intermediate holds, with countertrend shorts kept very short-term.
All readings on this track · 55 readings
- 1988Constructing price channels from trendlines
- 1988Three-point curved trend channel construction
- 1988Least-squares construction of channel trendlines
- 1988Three-zone price channel from quadratic smoothing
- 1989A variable-sensitivity stochastic built on three-sigma bounds
- 1989Close-minus-average oscillator for channel extremes
- 1989The six-stage hunt as a critique of one-click heroics
- 1990Fair-value gaps and a copper moving-average channel
- 1990Diversify markets, not systems, to cut trend-system variance
- 1991Constructing trendlines, price channels, and close-based breakouts
- 1991Constructing seasonal-cycle overlays with channel confirmation
- 1993Lag-compensated exponential trend channel construction
- 1993Constructing a lead-lag filter and price channel as one stack
- 1993Three stochastic warnings still need price-channel confirmation
- 1993Lead-lag smoothing for weekly trend-channel construction
- 1993Constructing zero-net-lag price channels
- 1995From a downtrend-line break to a regression channel
- 1995Validated trendline and price channel construction
- 1995Constructing price envelopes from averages, volatility, and regression
- 1996Constructing trendlines and channels from explicit swings
- 1998Fifty percent retracement as a channel regime test
- 1998Close-based channel rails as daily scenario maps
- 1999Constructing support, resistance, trendlines, and price channels
- 2001Cycle composites, price channels, and two-sided signals
- 2001Testing horizontal price channels with stops and scale
- 2002A two-stage momentum-shift and price-channel process
- 2002Wave-by-wave channel construction for Elliott counts
- 2002Affine channels as reusable trade hypotheses
- 2004Stress-test seasonal windows across regimes, then add channels
- 2004Regime permission from trendlines, channels, and range edges
- 2004Weekly-average and price-channel states on sector depositary baskets
- 2005Oil services catch-up after channel resistance breaks
- 2005Constructing a volatility-normalized cycle index
- 2005How a Darvas channel becomes a complete entry and exit procedure
- 2005Clustered Fibonacci and channel levels in news-driven forex
- 2005Treat a consolidating currency market as a time-frame problem
- 2005Channel walls that flip roles or recapture price
- 2006Stacking candlesticks, crossovers, and price channels
- 2006Failed uptrend channel breakout left the euro rangebound
- 2006Constructing a Wilson relative price channel from a range-bound strength index
- 2007Range bars change when a Bollinger squeeze counts as a breakout
- 2009One testable SPY procedure for a price channel, a trend rule, and a seasonal overlay
- 2010A gold-miner channel plan from value to false breakouts
- 2010A multi-timeframe channel from value to an overvalued zone
- 2010Asymmetric price channel construction for congested markets
- 2011Phasing many cycles at once with nested envelopes
- 2012Constructing adaptive horizontal price channels
- 2014Confirming support with trendlines, channels, and retracements
- 2015News-sentiment confirmation for support, channel, and volume tests
- 2015A three-layer permission stack: moving averages, a price channel, and weekly levels
- 2016Entropy-diff as a regime switch between trend following and a price channel
- 2017Competing rulers on a pound chart after Brexit
- 2017Test consolidation channel breakouts as one procedure
- 2020Constructing late-trend longs with a price channel, gap breakout, and trailing stop
- 2025Using IBM's multi-year price channel as a breakout teaching case