1992issue C071-5
Channel-height ratios for equity trend evaluation
Nested high-low price channels were turned into channel-height ratios and compared with a square-root baseline. The runs test asked whether expansion beat that no-trend forecast on a defined sampling interval and lookback.
- Channel-height ratios were formed at lookbacks of 1, 4, 9, 16, 25, 36, and 49 sessions by dividing each average multi-session price-channel height by the average one-session range.
- Trend tendency was scored only when a channel-height ratio exceeded the square-root baseline, the explicit no-trend envelope used in the runs test.
- On the full sample, all seven equities sat above that envelope, the NASDAQ composite led the indexes at every lookback, and the Dow Jones Industrial Average stayed below the baseline at every lookback.
- Editorial reading: a series that does not outgrow the square-root baseline across successive lookbacks fails the no-trend runs test and should not proceed to trend-following evaluation.
How the nested price channels were measured
A price channel is the high-low envelope taken over a fixed number of sessions. Its average height is the raw measurement used to score expansion.
Average high-low channel heights were computed at lookbacks of 1, 4, 9, 16, 25, 36, and 49 sessions. Each average was then divided by the one-session average to form a channel-height ratio, a dimensionless scale of multi-session height relative to the average one-session range.
The calculation window used daily observations from 2 January 1985 through 31 January 1992. Holiday rows were removed first, and only series with history before 1985 were admitted.
Scoring trend tendency with a runs test
Trend tendency was scored by asking whether the channel-height ratio exceeded the square root of channel length. That square-root baseline is the no-trend envelope for the evaluation, and a ratio above the envelope is treated as excess directional expansion.
The runs test is an ordered-range comparison that asks whether observed channel expansion beats an explicit random-walk forecast over a defined sampling interval and lookback.
Full-sample ranks among indexes and equities
On the full seven-year-and-one-month sample, the NASDAQ composite produced the largest index ratios at every reported lookback, while the Dow Jones Industrial Average stayed below the square-root baseline at every lookback.
Across the seven individual equities, every full-sample ratio sat above the square-root envelope. Eli Lilly posted the largest values and Xerox the smallest.
Index ratios generally increased with the number of constituents, yet the Major Market Index still outranked the Dow industrials on the same channel-height scale.
Alternative windows and a shorter cash index sample
Each series was recomputed on six windows: the full sample, the first year, the first two years, the last year, the last two years, and a middle year. For the OEX, window-to-window ratio gaps approached 10 percent, but the rise from short to long channels did not reverse.
The cash S&P 500 sample spanned only six years and seven months and was not interchangeable with a spliced-futures application of the same ratio method over a different interval.
Dow Jones Industrial Average, January 1985–January 1992
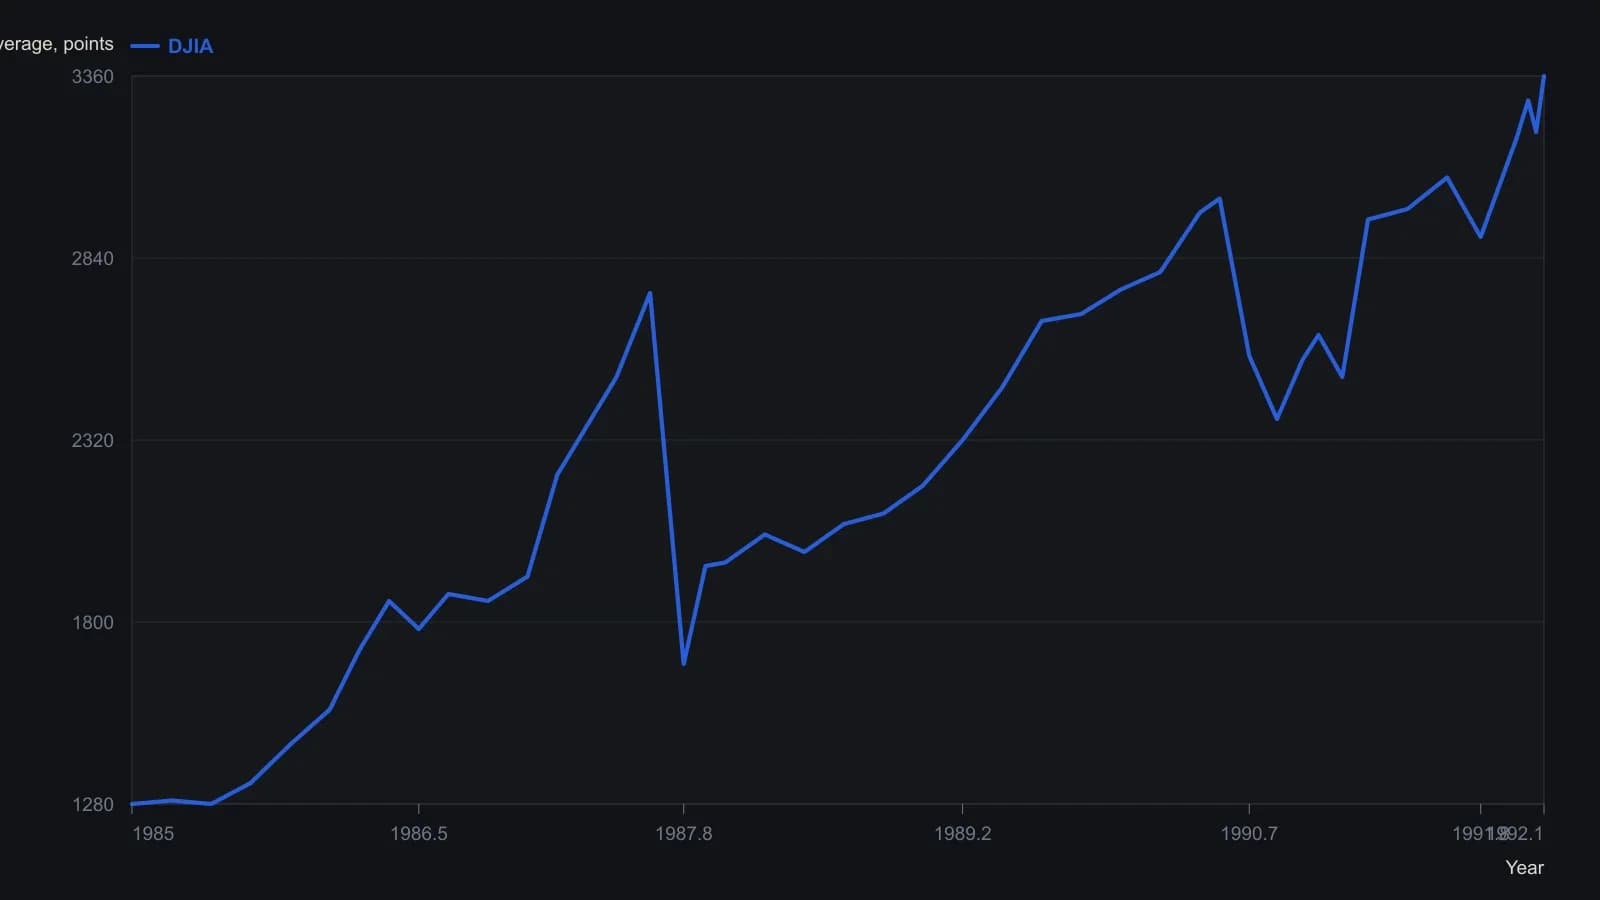
Digitized from the printed curve; readings are good to roughly 20–30 Dow points. The source study dropped holiday bars before computing channel heights; this series follows the published ink only.
All readings on this track · 15 readings
- 1986Constructing runs and persistence tests from labeled prices
- 1986Evaluating daily price and volume serial independence windows
- 1986Evaluating advance-decline plus-day runs against chance baselines
- 1986Weekly resamples as a diagnostic filter for statistical windows
- 1988Runs test as a critique of price-series memory
- 1989Evaluating weekday close direction with a counted baseline
- 1989Statistical windows for indicator time parameters
- 1992Channel-height ratios for equity trend evaluation
- 2001A runs test before volatility and expected-value sizing
- 2005Constructing runs-test z-scores for signed return persistence
- 2005Evaluating persistence with runs and autocorrelation
- 2005Weekday FX turning points and close run tests
- 2013Constructing a runs-test turn forecast
- 2017Star rating from slope and swing runs
- 2018Regime-dependent odds after directional price runs