2006issue C031-3
Stacking candlesticks, crossovers, and price channels
A daily US Dollar Index example pairs harami and engulfing candles with a three-day versus five-day moving-average cross, then checks those local signals against a weekly price channel. Editorially, entries and exits read as a three-gate stack: the candle states a hypothesis, the short cross times the action, and the higher-timeframe channel can veto the trade.
- Treat a candlestick pattern as a directional hypothesis, then use a three-day versus five-day moving-average cross as timing rather than a standalone trigger.
- Judge daily signals against a weekly map of support, resistance, and channel highs so a short-term setup can be stood aside.
- Repeated failure to hold above a known resistance can mark fading buyers; if that same level is later broken and reclaimed, it can act as support.
- Unconfirmed candle reversals inside a channel or a strong trend are described as more likely to produce false signals.
A three-gate stack
Editorially, entries and exits can be read as a three-gate stack. A candlestick pattern states the hypothesis. A short moving-average crossover times the action. A higher-timeframe price channel can veto the trade. The archive does not name those gates. What it shows is a daily US Dollar Index example that pairs a three-day versus five-day moving-average cross with harami and engulfing candlestick patterns to mark candidate buy and sell points.
A single indicator is said to produce too many false signals and whipsaws, while too many indicators produce analysis paralysis. Combining candlestick patterns, a moving-average crossover, and at least two time frames is offered as a middle path.
The candle proposes, the short cross times
Candlestick patterns are repeatable open-high-low-close shapes and multi-bar formations, such as harami, engulfing, doji, and tweezer structures. They are used to read short-term pressure and propose a directional hypothesis. Candle-by-candle reading of the open, the close, the relation to prior bars, the place in the trend, and nearby support or resistance is presented as usable from one-minute through monthly charts.
A moving-average crossover is a timing rule, not a standalone trigger. Here the faster average is a three-day line and the slower average is a five-day line. On the daily US Dollar Index example, that cross is paired with harami and engulfing patterns to mark candidate buy and sell points only after the candle has already stated a hypothesis.
When resistance fails, then flips
Three failed attempts in five sessions to clear US Dollar Index resistance at 90.20 are used to illustrate fading short-term buying pressure and a shift toward selling. That repeated inability to hold above a known resistance area is a failed-breakout reading: buyers are fading and the chance of a turn is rising.
After 90.20 is broken and then reclaimed, that same level is treated as support. Covering by traders who had sold beneath it is described as adding buying pressure. That resistance-to-support shift changes how both longs and shorts are expected to behave around the level.
An exit still needs the rest of the stack
An exit that waits for the next session to violate the prior low after three seller-won candles is noted as lacking other confirmation. It is later characterized as a shakeout when buyers resumed. Editorially, a candle event without the crossover cue and without a clear place on the larger map is not treated as enough to close or reverse.
A later bullish harami that follows a bearish engulfing pattern is flagged as a lower-probability long because it forms under historic resistance. The pattern still states a hypothesis. The location keeps that hypothesis from standing alone.
The weekly channel can veto a daily long
A weekly US Dollar Index chart is used to locate longer-term support and resistance so those levels can be applied to shorter-term trades. That is time-frame-alignment: a local signal is judged inside the larger structure rather than in isolation.
A price channel is a higher-timeframe band of support and resistance that marks whether a short-term signal is occurring inside congestion, under a high-water mark, or after a historical barrier has cleared. A channel top from April 2004 through the November 2005 high is cited as a reason to stay out of a late-November long until historical resistance is cleared.
Weekly US Dollar Index versus the channel top
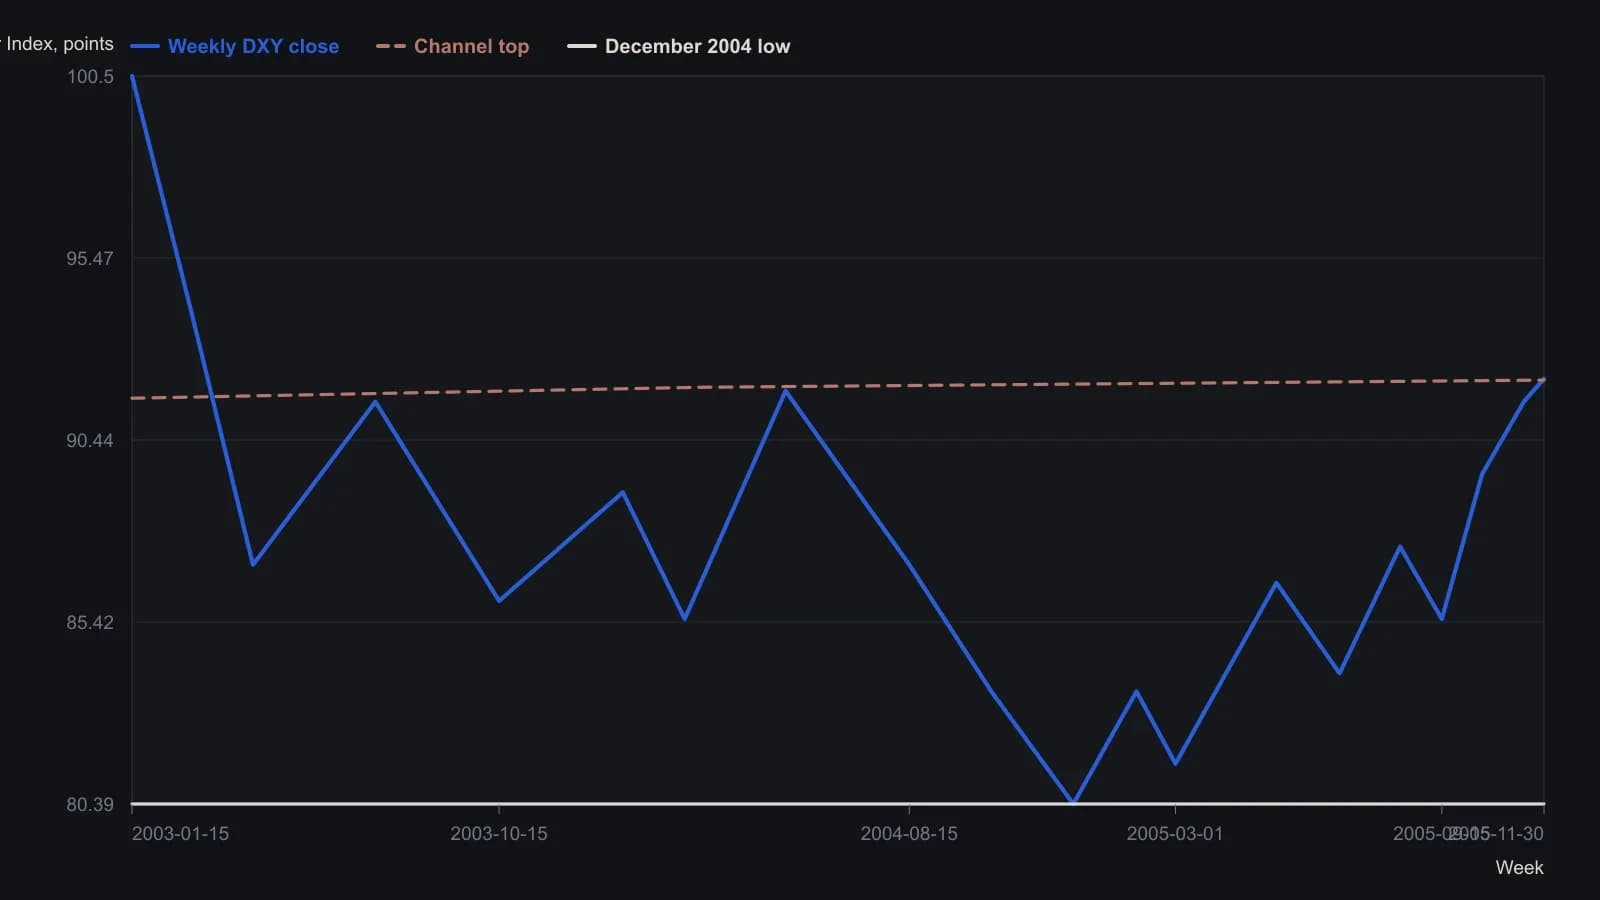
Intermediate closes are approximate to about one index point. The December 2004 low (80.39) and the 30 November 2005 close (92.14) are stated on the figure. Dates follow the printed weekly axis; the left edge sits at the top of the 101 scale in early 2003. The blue high-water mark is the April 2004–November 2005 channel top.
Enough confirmation without paralysis
The archive’s middle path is narrow on purpose. Candlestick patterns supply the hypothesis. The three-day versus five-day moving-average crossover supplies timing. At least two time frames, including a weekly map of the price channel, supply context that can keep a late long on the sideline until historical resistance is cleared.
Editorially, the stack is a filter on action, not a claim that any one gate is sufficient. A pattern without the cross, a cross without a pattern, or either of those under an uncleared channel top is left as a non-actionable reading.
All readings on this track · 55 readings
- 1988Constructing price channels from trendlines
- 1988Three-point curved trend channel construction
- 1988Least-squares construction of channel trendlines
- 1988Three-zone price channel from quadratic smoothing
- 1989A variable-sensitivity stochastic built on three-sigma bounds
- 1989Close-minus-average oscillator for channel extremes
- 1989The six-stage hunt as a critique of one-click heroics
- 1990Fair-value gaps and a copper moving-average channel
- 1990Diversify markets, not systems, to cut trend-system variance
- 1991Constructing trendlines, price channels, and close-based breakouts
- 1991Constructing seasonal-cycle overlays with channel confirmation
- 1993Lag-compensated exponential trend channel construction
- 1993Constructing a lead-lag filter and price channel as one stack
- 1993Three stochastic warnings still need price-channel confirmation
- 1993Lead-lag smoothing for weekly trend-channel construction
- 1993Constructing zero-net-lag price channels
- 1995From a downtrend-line break to a regression channel
- 1995Validated trendline and price channel construction
- 1995Constructing price envelopes from averages, volatility, and regression
- 1996Constructing trendlines and channels from explicit swings
- 1998Fifty percent retracement as a channel regime test
- 1998Close-based channel rails as daily scenario maps
- 1999Constructing support, resistance, trendlines, and price channels
- 2001Cycle composites, price channels, and two-sided signals
- 2001Testing horizontal price channels with stops and scale
- 2002A two-stage momentum-shift and price-channel process
- 2002Wave-by-wave channel construction for Elliott counts
- 2002Affine channels as reusable trade hypotheses
- 2004Stress-test seasonal windows across regimes, then add channels
- 2004Regime permission from trendlines, channels, and range edges
- 2004Weekly-average and price-channel states on sector depositary baskets
- 2005Oil services catch-up after channel resistance breaks
- 2005Constructing a volatility-normalized cycle index
- 2005How a Darvas channel becomes a complete entry and exit procedure
- 2005Clustered Fibonacci and channel levels in news-driven forex
- 2005Treat a consolidating currency market as a time-frame problem
- 2005Channel walls that flip roles or recapture price
- 2006Stacking candlesticks, crossovers, and price channels
- 2006Failed uptrend channel breakout left the euro rangebound
- 2006Constructing a Wilson relative price channel from a range-bound strength index
- 2007Range bars change when a Bollinger squeeze counts as a breakout
- 2009One testable SPY procedure for a price channel, a trend rule, and a seasonal overlay
- 2010A gold-miner channel plan from value to false breakouts
- 2010A multi-timeframe channel from value to an overvalued zone
- 2010Asymmetric price channel construction for congested markets
- 2011Phasing many cycles at once with nested envelopes
- 2012Constructing adaptive horizontal price channels
- 2014Confirming support with trendlines, channels, and retracements
- 2015News-sentiment confirmation for support, channel, and volume tests
- 2015A three-layer permission stack: moving averages, a price channel, and weekly levels
- 2016Entropy-diff as a regime switch between trend following and a price channel
- 2017Competing rulers on a pound chart after Brexit
- 2017Test consolidation channel breakouts as one procedure
- 2020Constructing late-trend longs with a price channel, gap breakout, and trailing stop
- 2025Using IBM's multi-year price channel as a breakout teaching case