2014issue C1020-25
Confirming support with trendlines, channels, and retracements
A support or resistance zone is treated as a falsifiable hypothesis only when a trendline, a parallel price-channel edge, and a Fibonacci retracement land on the same price.
- Treat a support or resistance zone as a three-tool vote: a trendline, a price-channel edge, and a Fibonacci retracement must land on the same price before the level is a falsifiable hypothesis.
- Bullish and bearish turns are four-event sequences whose order can vary: a reach to a support, resistance, retracement, or target; a channel-break; and the matching higher or lower swing pair.
- A single trend can pass through three line adjustments, and the same EURUSD stretch needed one downward trendline on a 10-pip range-bar chart but several successive lines on a 30-minute candlestick chart.
- In the GBPUSD walk-through, the 50% retracement, role-reversal of a prior support, and the upper price-channel boundary arrived on the same rise.
A three-tool vote
Editorial reading of this archive treats a support or resistance zone as a three-tool vote. A trendline, a parallel price-channel edge, and a Fibonacci retracement must land on the same price before that level is treated as a falsifiable hypothesis rather than a hunch about the trend.
The archive describes a support, resistance, or target zone as more reliable when separate techniques mark the same price. The walk-throughs show how those techniques are drawn and when they stacked.
How each tool marks a price
A trendline is a straight line through two or more swing lows or highs, extended forward and judged intact by whether closes stay on the trend side of the line. An uptrend line joins two or more lows and remains valid while closes stay above it. A downtrend line joins two or more highs and remains valid while closes stay below it.
A price-channel is a pair of parallel lines made by copying a trendline to the opposite swing so both edges can mark expected turning zones. After an initial steep uptrend line breaks, a flatter line can be copied to the opposite highs to form a parallel price channel, with turns expected when price reaches either channel edge.
A Fibonacci retracement is a set of percentage pullback levels measured between a swing high and a swing low. Those levels are used as candidate support or resistance that gain weight when they coincide with a trendline or a price-channel edge.
Horizontal support and resistance lines are placed through turning points or gaps. Those lines are static-levels. A close through the line is treated as a break, after which a former resistance can later act as support. That later use is role-reversal. A dynamic-level is a moving reference, such as a simple moving average, that travels with price and can act as support or resistance.
Four events in a turn
A bullish turn is framed as four events whose order can vary. Price reaches a downtrend support, a retracement, or a target. Price breaks upward through a downward channel or a flat range. A higher low appears. A higher high appears. The upward close through the channel or range is a channel-break.
A bearish turn is framed as four events whose order can vary. Price reaches an uptrend resistance, a retracement, or a target. Price breaks downward through an uptrend channel or range. A lower high appears. A lower low appears.
When separate techniques mark the same price
A support, resistance, or target zone is described as more reliable when separate techniques mark the same price. The GBPUSD walk-through stacked a trendline, a copied channel, and Fibonacci retracements including 23.6%, 38.2%, 50%, and 61.8%.
In the GBPUSD sequence, an April reaction supplied an uptrend line that was copied to the prior top to form a channel. The later rise reached the 50% retracement, a prior support flipped to resistance, and the upper channel boundary together.
In a 30-minute futures example, the first resistance in a topping sequence sat at the 38.2% Fibonacci retracement and at a 50-bar simple moving average.
Line adjustments and chart scale
A single trend is described as able to pass through three line adjustments. Price follows the line until a break. Acceleration forces a steeper line, often late in an advance. A moderate break with a slower pace forces a flatter line, often late in a decline.
Chart scale changes how many of those lines a stretch needs. Over the same EURUSD stretch from 12 December 2013 to 16 December 2013, a 10-pip range-bar chart allowed one downward trendline, while a 30-minute candlestick chart of that move required several successive lines.
GBPUSD daily: trendline, channel, and Fibonacci votes at the same prices
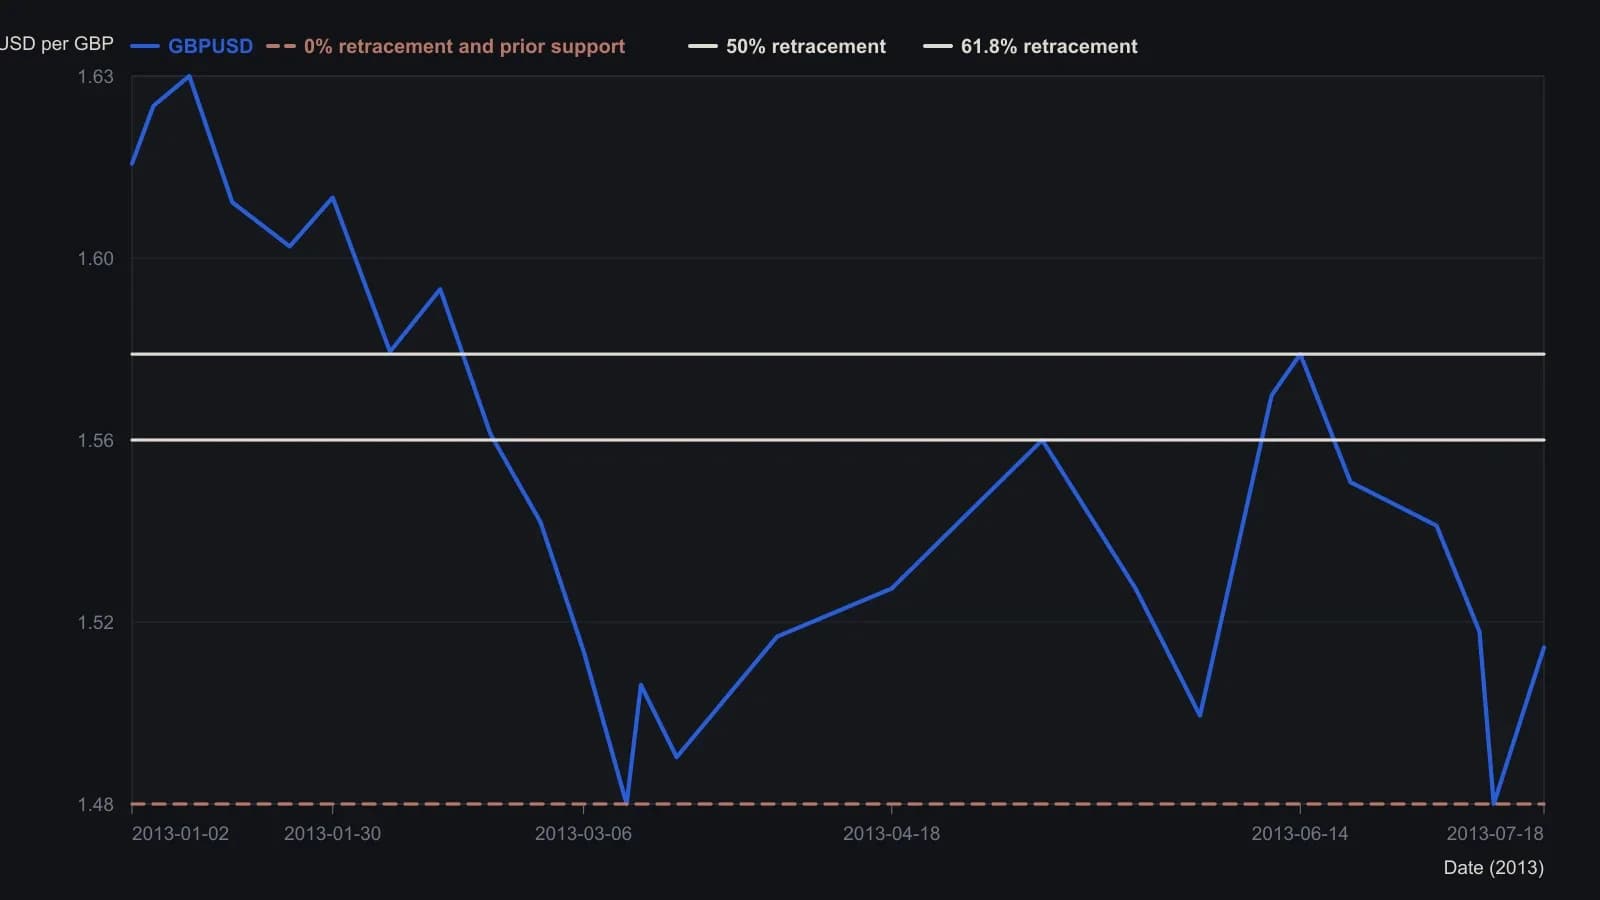
Fibonacci prices on the source scale are exact. Other closes are read from daily candlesticks on a 1.47–1.64 axis (about ±0.002). Dates follow the month axis (13, then F–J) and the article’s mid-March, early-April, and end-of-May anchors, not a printed table. The 50-, 100-, and 200-day averages drawn on the source are omitted.
All readings on this track · 55 readings
- 1988Constructing price channels from trendlines
- 1988Three-point curved trend channel construction
- 1988Least-squares construction of channel trendlines
- 1988Three-zone price channel from quadratic smoothing
- 1989A variable-sensitivity stochastic built on three-sigma bounds
- 1989Close-minus-average oscillator for channel extremes
- 1989The six-stage hunt as a critique of one-click heroics
- 1990Fair-value gaps and a copper moving-average channel
- 1990Diversify markets, not systems, to cut trend-system variance
- 1991Constructing trendlines, price channels, and close-based breakouts
- 1991Constructing seasonal-cycle overlays with channel confirmation
- 1993Lag-compensated exponential trend channel construction
- 1993Constructing a lead-lag filter and price channel as one stack
- 1993Three stochastic warnings still need price-channel confirmation
- 1993Lead-lag smoothing for weekly trend-channel construction
- 1993Constructing zero-net-lag price channels
- 1995From a downtrend-line break to a regression channel
- 1995Validated trendline and price channel construction
- 1995Constructing price envelopes from averages, volatility, and regression
- 1996Constructing trendlines and channels from explicit swings
- 1998Fifty percent retracement as a channel regime test
- 1998Close-based channel rails as daily scenario maps
- 1999Constructing support, resistance, trendlines, and price channels
- 2001Cycle composites, price channels, and two-sided signals
- 2001Testing horizontal price channels with stops and scale
- 2002A two-stage momentum-shift and price-channel process
- 2002Wave-by-wave channel construction for Elliott counts
- 2002Affine channels as reusable trade hypotheses
- 2004Stress-test seasonal windows across regimes, then add channels
- 2004Regime permission from trendlines, channels, and range edges
- 2004Weekly-average and price-channel states on sector depositary baskets
- 2005Oil services catch-up after channel resistance breaks
- 2005Constructing a volatility-normalized cycle index
- 2005How a Darvas channel becomes a complete entry and exit procedure
- 2005Clustered Fibonacci and channel levels in news-driven forex
- 2005Treat a consolidating currency market as a time-frame problem
- 2005Channel walls that flip roles or recapture price
- 2006Stacking candlesticks, crossovers, and price channels
- 2006Failed uptrend channel breakout left the euro rangebound
- 2006Constructing a Wilson relative price channel from a range-bound strength index
- 2007Range bars change when a Bollinger squeeze counts as a breakout
- 2009One testable SPY procedure for a price channel, a trend rule, and a seasonal overlay
- 2010A gold-miner channel plan from value to false breakouts
- 2010A multi-timeframe channel from value to an overvalued zone
- 2010Asymmetric price channel construction for congested markets
- 2011Phasing many cycles at once with nested envelopes
- 2012Constructing adaptive horizontal price channels
- 2014Confirming support with trendlines, channels, and retracements
- 2015News-sentiment confirmation for support, channel, and volume tests
- 2015A three-layer permission stack: moving averages, a price channel, and weekly levels
- 2016Entropy-diff as a regime switch between trend following and a price channel
- 2017Competing rulers on a pound chart after Brexit
- 2017Test consolidation channel breakouts as one procedure
- 2020Constructing late-trend longs with a price channel, gap breakout, and trailing stop
- 2025Using IBM's multi-year price channel as a breakout teaching case