2017issue C0130-31
Competing rulers on a pound chart after Brexit
A featured pound chart stacked a daily channel, a Fibonacci turning-point reading at 1.3351, the 1.3000 whole number, and the 1985 low as alternative overlays. This note keeps each ruler as its own falsifiable hypothesis rather than one blended call.
- One style treated the lower boundary of the daily price channel as the operative entry-and-exit reference.
- A Fibonacci 261.8 reading marked 1.3351 as a turning-point objective rather than a mid-swing pullback.
- The 1.3000 whole number and the 1985 low each stood as a discrete support or exit hypothesis on the same chart.
- Safe-haven flows and the rate episode locate the Brexit-reaction backdrop. A later limit-down halt in e-mini S&P 500 futures is a separate shock session, not a pound overlay.
Why the rulers stay separate
The featured pound chart is used here as a case in competing references, not as a single isolated method. A daily channel, Fibonacci levels, the 1.3000 whole number, and the 1985 low were stacked as alternative overlays.
Editorial: the teaching aim is to keep those overlays in competition. The daily channel locates the swing, a Fibonacci measured objective names a turning point, and the round number plus the multi-decade low each stand as a separate support hypothesis that can be accepted or rejected.
Shock backdrop around the pound chart
During the Brexit reaction, the US dollar, Japanese yen, and Swiss franc rose as funds moved toward perceived safe-haven currencies. The benchmark 10-year US Treasury reached its lowest level since 2012 in that episode. German 10-year bonds traded below zero for the first time during the same period.
On the night of 8 November 2016, e-mini S&P 500 futures declined more than 120 points and trading was halted in a limit-down condition.
Editorial: the first cluster locates the pound chart in a shock-driven tape. The November session is a later shock from the same historical file. Neither fact converts the pound overlays into one market call.
Daily channel as one swing reference
A price channel is a pair of parallel boundaries taken from swing highs and lows so later price can be judged as holding, tagging, or leaving the structure. The daily channel is that structure drawn on the daily scale.
One entry-and-exit style used the lower boundary of the daily price channel as the operative reference.
Editorial: that lower boundary locates the swing. It remains one reference line among several, not a summary of the Fibonacci grid or the support tests.
Fibonacci objective at 1.3351
A Fibonacci retracement, in this case, is a measured grid taken from a completed swing. On the featured pound chart, a Fibonacci reading marked 1.3351 as a turning-point objective at the 261.8 level.
A turning point is a chart location where a measured objective is hypothesized to stall or reverse. The 261.8 reading is used to name that objective rather than a mid-swing pullback.
Two independent support tests
Support and resistance here means prior reaction prices, round printed numbers, and long-horizon lows treated as discrete levels where an entry or exit hypothesis can be accepted or rejected.
Another style used the whole number 1.3000 as a discrete reference for entries or exits. A whole-number level is a round printed price used as a support or exit reference independent of the channel or Fibonacci grid.
A third style used the 1985 low as a long-horizon support reference on the same chart.
Editorial: the printed 1.3000 level and the 1985 low are two support hypotheses, not one blended floor.
Alternative overlays, not one method
The case stacked a daily channel, Fibonacci levels, the 1.3000 whole number, and the 1985 low as alternative overlays rather than a single isolated method.
Editorial: a later reader can keep, drop, or replace any one ruler without rewriting the others. That is the point of the stack.
Fibonacci measured-move ladder on daily GBPUSD
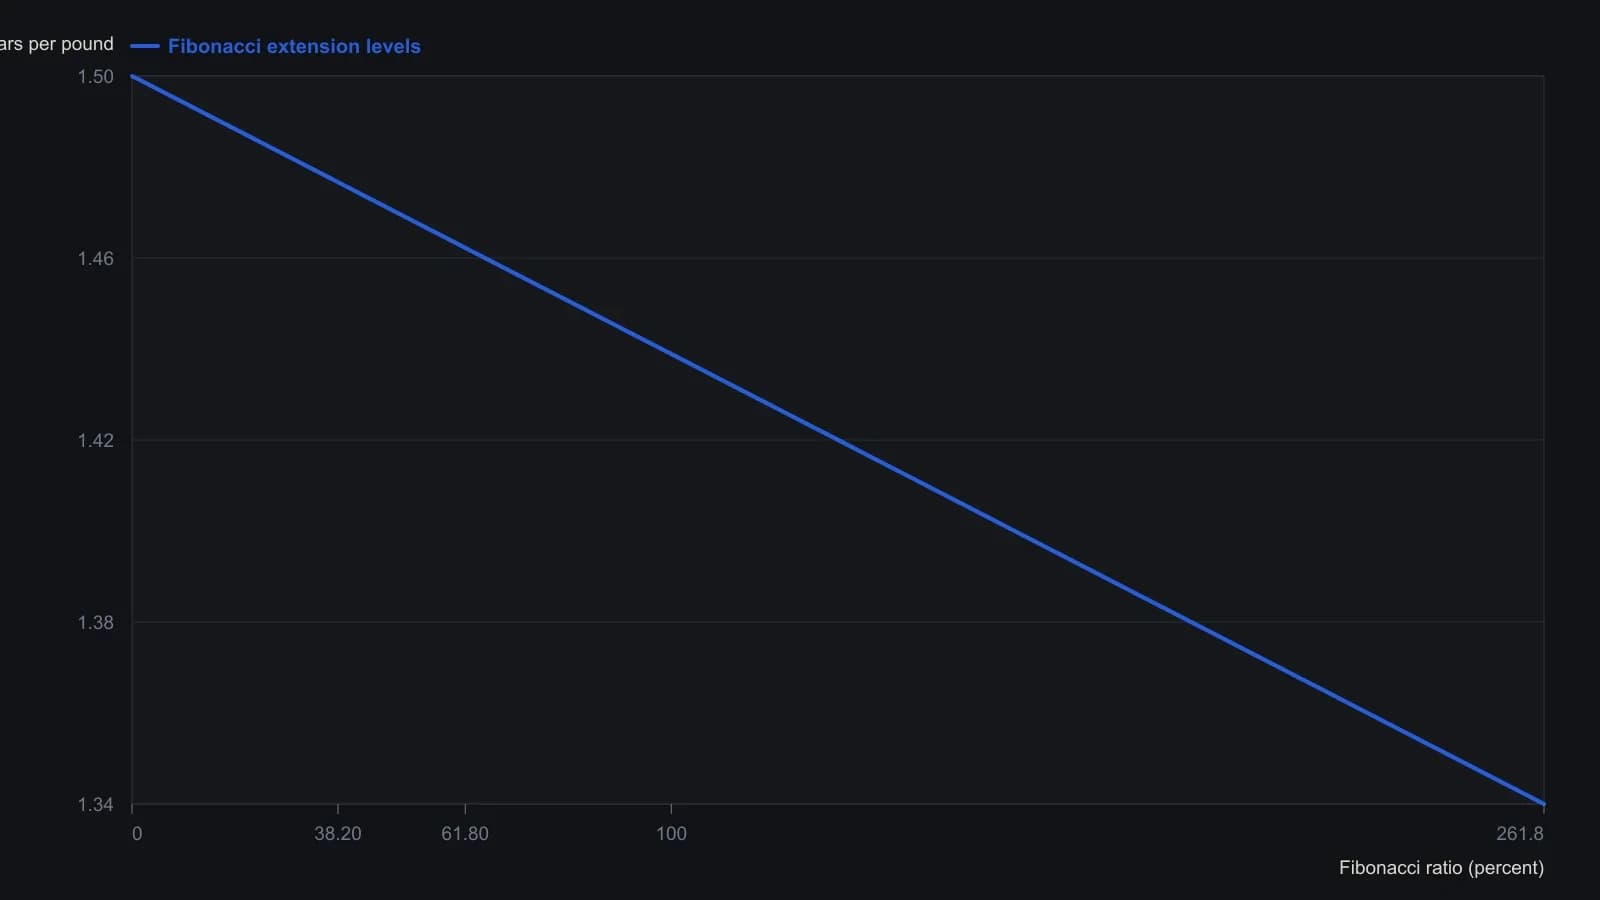
The magazine caption rounded the 261.8% print to 1.3351. The companion daily-channel pane, the 1.3000 round number, and the 1985 low are separate rulers and are not mixed into this series.
All readings on this track · 55 readings
- 1988Constructing price channels from trendlines
- 1988Three-point curved trend channel construction
- 1988Least-squares construction of channel trendlines
- 1988Three-zone price channel from quadratic smoothing
- 1989A variable-sensitivity stochastic built on three-sigma bounds
- 1989Close-minus-average oscillator for channel extremes
- 1989The six-stage hunt as a critique of one-click heroics
- 1990Fair-value gaps and a copper moving-average channel
- 1990Diversify markets, not systems, to cut trend-system variance
- 1991Constructing trendlines, price channels, and close-based breakouts
- 1991Constructing seasonal-cycle overlays with channel confirmation
- 1993Lag-compensated exponential trend channel construction
- 1993Constructing a lead-lag filter and price channel as one stack
- 1993Three stochastic warnings still need price-channel confirmation
- 1993Lead-lag smoothing for weekly trend-channel construction
- 1993Constructing zero-net-lag price channels
- 1995From a downtrend-line break to a regression channel
- 1995Validated trendline and price channel construction
- 1995Constructing price envelopes from averages, volatility, and regression
- 1996Constructing trendlines and channels from explicit swings
- 1998Fifty percent retracement as a channel regime test
- 1998Close-based channel rails as daily scenario maps
- 1999Constructing support, resistance, trendlines, and price channels
- 2001Cycle composites, price channels, and two-sided signals
- 2001Testing horizontal price channels with stops and scale
- 2002A two-stage momentum-shift and price-channel process
- 2002Wave-by-wave channel construction for Elliott counts
- 2002Affine channels as reusable trade hypotheses
- 2004Stress-test seasonal windows across regimes, then add channels
- 2004Regime permission from trendlines, channels, and range edges
- 2004Weekly-average and price-channel states on sector depositary baskets
- 2005Oil services catch-up after channel resistance breaks
- 2005Constructing a volatility-normalized cycle index
- 2005How a Darvas channel becomes a complete entry and exit procedure
- 2005Clustered Fibonacci and channel levels in news-driven forex
- 2005Treat a consolidating currency market as a time-frame problem
- 2005Channel walls that flip roles or recapture price
- 2006Stacking candlesticks, crossovers, and price channels
- 2006Failed uptrend channel breakout left the euro rangebound
- 2006Constructing a Wilson relative price channel from a range-bound strength index
- 2007Range bars change when a Bollinger squeeze counts as a breakout
- 2009One testable SPY procedure for a price channel, a trend rule, and a seasonal overlay
- 2010A gold-miner channel plan from value to false breakouts
- 2010A multi-timeframe channel from value to an overvalued zone
- 2010Asymmetric price channel construction for congested markets
- 2011Phasing many cycles at once with nested envelopes
- 2012Constructing adaptive horizontal price channels
- 2014Confirming support with trendlines, channels, and retracements
- 2015News-sentiment confirmation for support, channel, and volume tests
- 2015A three-layer permission stack: moving averages, a price channel, and weekly levels
- 2016Entropy-diff as a regime switch between trend following and a price channel
- 2017Competing rulers on a pound chart after Brexit
- 2017Test consolidation channel breakouts as one procedure
- 2020Constructing late-trend longs with a price channel, gap breakout, and trailing stop
- 2025Using IBM's multi-year price channel as a breakout teaching case