1991issue C101-7
Constructing compressed candlestick summaries
Editorial framing treats candlestick study as a two-pass construction drill. Draw every bar from a declared open, high, low, and close, then collapse the same window into one compressed-candlestick. A named pattern is treated as a trade hypothesis only when both constructions agree.
- Draw each candle from a declared open, high, low, and close, filling the candle-body when the open sits above the close and leaving it unfilled when the close sits above the open.
- A compressed-candlestick takes the first open, the last close, and the extreme high and low of the whole group, which can disagree with a named-pattern reading when a large gap is present.
- A named candlestick pattern is treated as complete as soon as its last candle has finished forming, and those messages are presented as needing confirmation from other technical tools.
- Editorial practice treats a named pattern as a trade hypothesis only when the bar-by-bar construction and the compressed-candlestick agree.
A two-pass construction drill
Editorial framing treats candlestick study as a two-pass construction drill. The first pass draws every bar from a declared open, high, low, and close. The second pass collapses the same window into one compressed-candlestick.
Candlestick reading is presented in those two constructions: compress several bars into one summary candle, or match the sequence to a named multi-bar pattern in its surrounding trend. Editorial reading treats a named pattern as a trade hypothesis only when both constructions agree.
Draw every bar from a declared rule
A candlestick is drawn from a period's open, high, low, and close. The candle-body is the rectangle between open and close. It is filled when the open is above the close and left unfilled when the close is above the open.
The same session can produce differently shaped candles across data sources because opening and closing prices may be defined as an average, a median, a first reported print, or another convention. Editorial practice is to declare that convention before the first bar is drawn.
Read the shadows as failed pushes
Shadows are the thin lines from that body to the period high and the period low. The upper-shadow records trade above the body that was not held into the close. The lower-shadow records trade below the body that was not held into the close.
A long upper-shadow is treated as a failed push higher given back before the close. A long lower-shadow is treated as a failed push lower given back before the close.
Compress the same window into one candle
A multi-bar sequence is compressed into one compressed-candlestick by taking the first bar's open, the last bar's close, and the highest high and lowest low of the entire group.
When a sequence contains a large gap, the named-pattern reading and the compressed-candlestick can disagree because the gap is not carried into the summary bar.
Match the sequence to a named pattern
A named candlestick pattern is treated as complete as soon as its last candle has finished forming.
A doji is a candle whose open and close sit at essentially the same level, leaving little or no body. A hammer is a small body near the top of the range with a long lower-shadow, read after a decline as a possible loss of downside follow-through. A harami is a smaller body contained inside the prior larger body, treated as a caution that direction is unresolved.
A tweezer uses matching highs or lows on neighboring candles to mark a short-term extreme. A rising-three-method is a continuation construction in which a long unfilled candle is followed by a small consolidating group and then another strong unfilled candle.
A two-bar dark-cloud-cover construction is described as clearer only when the second filled body reaches at least the midpoint of the prior unfilled body.
Ask other tools for confirmation
The material treats candlestick messages as needing confirmation from other technical tools rather than being used in isolation.
Daily June 1991 S&P 500 futures
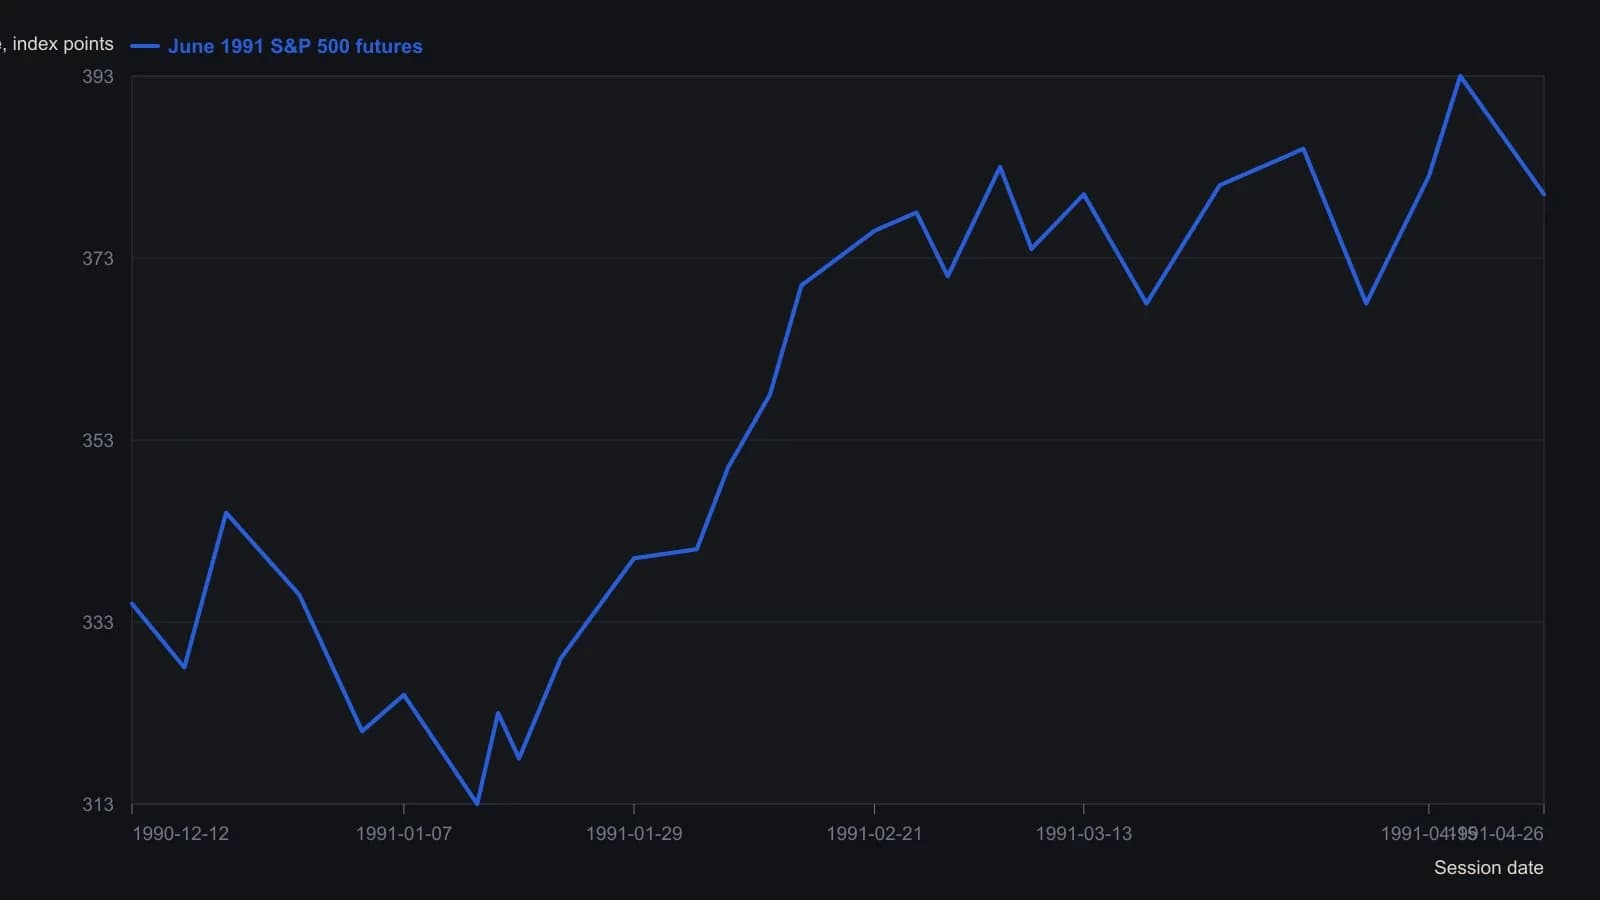
Approximate levels taken off the published candlestick plot to the nearest index point, following the visible body path and the marked highs and lows. The raster does not support settlement ticks. Pattern letters A–P on the original figure are not plotted here.
All readings on this track · 54 readings
- 1990Constructing three-session rally and reaction volume signals
- 1991Constructing candlestick real bodies and multi-session patterns
- 1991Treat a candlestick reversal as incomplete until %D confirms it
- 1991Filtering candlestick signals with stochastic percent-D
- 1991Constructing compressed candlestick summaries
- 1993Intraday candlestick confirmation with oscillators
- 1993Candlestick hypotheses from a 1993 reading list
- 1994License candlestick signals with oscillators and weekly vetoes
- 1995Real-body support, resistance, and close-through breakouts
- 1997Weekly reversal as a three-part hypothesis
- 1998Turning fear levels into testable rules with a psychological matrix
- 2000Evaluating three-bar reversal reliability
- 2000Prior-day candles, open confirmation, and same-session stops
- 2000Intraday candlestick volume confirmation for daytrading
- 2001Count the key reversal up before coding a mechanical exit
- 2001Rising and falling three continuation candle construction
- 2002Treat a moving average as a contested fence
- 2003Candlestick signals need support and a risk-reward screen
- 2003Constructing one-day reversal tops and bottoms
- 2003Chart sentiment as a regime filter for hourly stochastic entries
- 2004Confirming index reversals with candlesticks, stochastics and averages
- 2004The harami inner close as a reversal barometer
- 2004Constructing a true-range volume power-shift filter
- 2005Weighing reversal clusters against moving-average support
- 2005Candlestick exits confirmed by overbought stochastics
- 2005Confirming piercing patterns with stochastics and moving averages
- 2006Candlestick cluster exits confirmed by overbought stochastics
- 2007Three black crows become a trade hypothesis only after regime, trend and nearby levels
- 2008Asymmetrical RSI lookbacks for divergence and candle confirmation
- 2008A permission checklist for the end of a trend
- 2010Mechanical entries still need confirmation gates
- 2010Crude oil as a case study in candlestick session reading
- 2010Gold weekly candles and the thousand resistance breakout
- 2010A three-layer gold chart drill from waves to candle confirmation
- 2011Why entry scans fail without trend filters
- 2011Price-zone oscillator trend-regime rules
- 2011A candlestick checklist before commodity entries
- 2013Step candle construction at price turning points
- 2013Two-bar step-candle construction
- 2014Small-range bars as a timed volume-climax hypothesis
- 2014Constructing volume-scaled candlestick charts
- 2015Weekly range midpoints as support and resistance
- 2015Constructing weekly body-midpoint pattern codes
- 2015Evaluating encoded candlestick sequence hypotheses
- 2015Constructing a breakout relative-strength index from two-day range candles
- 2016A three-gate classroom on hourly sterling
- 2016Fibonacci retracement as a pre-commitment stop map
- 2017Nine-zone filter for decade-level breakouts
- 2017Constructing pin-bar and inside-bar setups
- 2017Two-bar soldier and crow rules become a system only after filters and exits
- 2017Confirm a one-white-soldier or one-black-crow before entry
- 2018Session control from marubozu and engulfing geometry
- 2019Volume, acceleration, and candle filters on a completed double bottom
- 2019Sector-filtered candlestick scans and predrawn stops