2010issue C0240-45
Gold weekly candles and the thousand resistance breakout
This weekly gold case teaches a three-filter drill. Name the candle, pin it to a previously mapped support or resistance shelf, and treat only a later weekly close through that shelf as the event that confirms or kills the hypothesis.
- Run the filters in order: name the weekly candle, pin it to a previously mapped shelf, then wait for a later weekly close through that shelf.
- A hammer after a decline is a candidate bottom, and that reading is described as stronger near support when the lower wick is several times the body.
- The 1000 area was treated as major resistance, and failed weekly probes there were framed as scouting attempts rather than accepted breakouts.
- Only a later weekly close through the mapped ceiling, then a multi-week hold labeled a beach head, confirmed the breakout hypothesis.
A three-filter gold case
Editorial reading. TradersWeek uses this weekly gold case to teach a three-filter drill. The first filter names the weekly candle as a single-session or multi-session open-high-low-close shape used to draft a reversal or continuation hypothesis. The second filter pins that candle to support and resistance, meaning prior price shelves that later become the reference for whether a candle idea is located in a meaningful place. The third filter waits for a breakout, meaning a later close through a previously tested ceiling or floor that accepts or rejects the earlier candle reading. Only a later weekly close through that shelf is treated as the event that confirms or kills the hypothesis.
Name the weekly candle
The first filter is naming. A hammer is a post-decline candle with a small body near the high and a long lower wick, treated as a candidate bottom because the session can close far from its low. That reading is described as stronger when the candle forms near support and the lower wick is several times the body. A dragonfly doji is distinguished from a hammer by having identical high, open, and close, whereas a hammer has open and close near each other and at or near the high. The dragonfly doji still leaves a long lower wick, with high, open, and close together at the top of the range.
A white marubozu is a long white session that opens on the low and closes on the high with no wicks. In an established uptrend it is read as continuation, and in a downtrend it can appear as a reversal piece inside a larger candle combination. A bullish harami is a two-session inside pattern: a small white body contained in a prior long black body. If the next candle is white and posts a higher high and a higher low, the three-session sequence is labeled three inside up.
A shooting star is a small body with a long upper wick after an advance, used as a candidate high. A ladder bottom is a multi-week decline sequence that ends with a long white candle after sellers lose control. A typical ladder bottom is described as three long black candles, a black inverted hammer, then a long white candle.
Pin each candle to a mapped shelf
On the weekly gold chart, a bullish harami in the week of 7 December 2007 formed near a 777 low. A later advance reached 1014 in the week of 21 March 2008, where a bearish engulfing marked the high. A shooting star coincided with an 18 July high of 986.
The late-2008 gold low of 681 was marked with a six-candle variation of the ladder bottom that used a small white inverted hammer and a black hammer before the large white candle. After the 681 low, a long-tailed hammer is described as a stronger bullish signal.
The 1000 area is treated as major resistance. The week of 21 March 2008 pushed through to 1014, later used as resistance line 3. A later attempt stalled at 986, later used as resistance line 2. Editorial reading. Those prior highs are the shelves later candles are pinned to. A candle idea is not treated as located until it sits against one of those mapped references.
Treat only a later weekly close as the event
Failed probes of that ceiling are framed as scouting attempts. A scouting attempt is a probe of the opposing side at a known resistance shelf. A hold above that shelf is treated as a beach head.
A mid-February 2009 weekly close above 1000 with a 1004 high failed when the next week opened at 996 and closed at 941.50. A June 2009 probe reached 990, missed 1000, but cleared resistance line 2. Later tops were marked by a bearish harami at a 1004 high on 2 February 2009 and another harami on 25 June 2009. The same 1000 zone is also framed as the early legs of a three-mountain top, meaning three tests of the same high zone, analogous to a western triple top.
The 2 October 2009 week is treated as the confirming breakout. Gold opened at 993 and closed at 1003. The next week opened at 1004 and closed at 1047. A multi-week hold above the old ceiling was labeled a beach head before price entered new high ground.
Editorial reading. The earlier weekly candles only drafted the hypothesis. The mapped 1000 shelf located it. Failed weekly probes show the same filter rejecting the idea when the next weekly close could not hold the ceiling. Only the later weekly close through that previously tested shelf confirmed the breakout.
Weekly gold tests of the $1,000 resistance
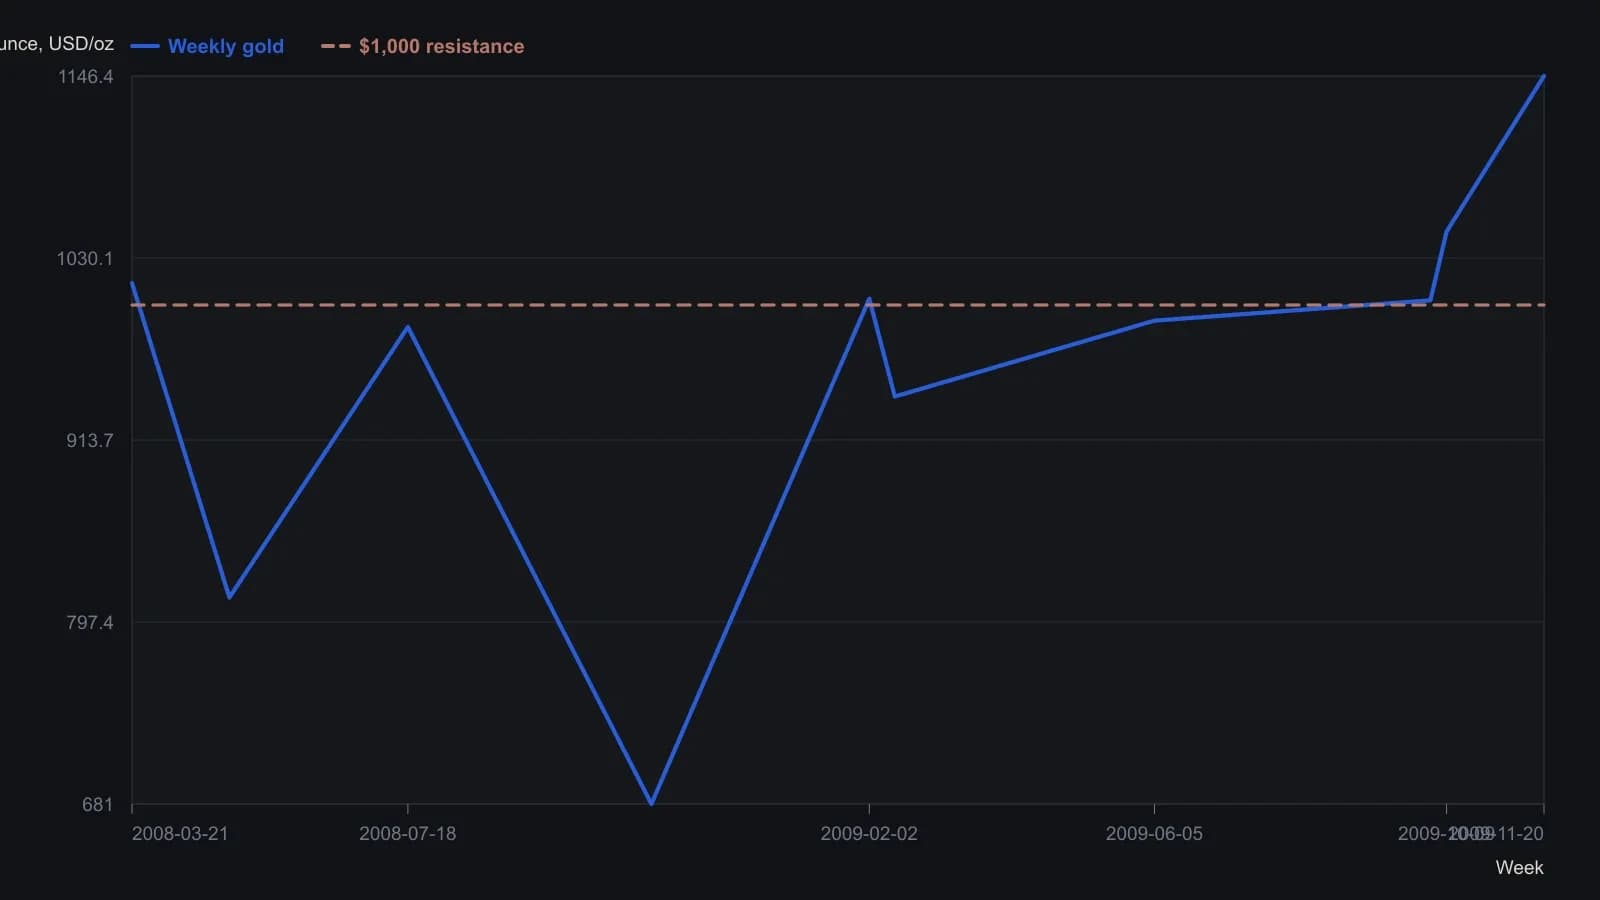
The source figure is weekly OHLC. This series keeps only the dated prices stated in the prose, so highs, lows, and closes are mixed and the $1,000 tests stay exact. Resistance line 2 is the 18 July 2008 shooting-star high at $986.
All readings on this track · 54 readings
- 1990Constructing three-session rally and reaction volume signals
- 1991Constructing candlestick real bodies and multi-session patterns
- 1991Treat a candlestick reversal as incomplete until %D confirms it
- 1991Filtering candlestick signals with stochastic percent-D
- 1991Constructing compressed candlestick summaries
- 1993Intraday candlestick confirmation with oscillators
- 1993Candlestick hypotheses from a 1993 reading list
- 1994License candlestick signals with oscillators and weekly vetoes
- 1995Real-body support, resistance, and close-through breakouts
- 1997Weekly reversal as a three-part hypothesis
- 1998Turning fear levels into testable rules with a psychological matrix
- 2000Evaluating three-bar reversal reliability
- 2000Prior-day candles, open confirmation, and same-session stops
- 2000Intraday candlestick volume confirmation for daytrading
- 2001Count the key reversal up before coding a mechanical exit
- 2001Rising and falling three continuation candle construction
- 2002Treat a moving average as a contested fence
- 2003Candlestick signals need support and a risk-reward screen
- 2003Constructing one-day reversal tops and bottoms
- 2003Chart sentiment as a regime filter for hourly stochastic entries
- 2004Confirming index reversals with candlesticks, stochastics and averages
- 2004The harami inner close as a reversal barometer
- 2004Constructing a true-range volume power-shift filter
- 2005Weighing reversal clusters against moving-average support
- 2005Candlestick exits confirmed by overbought stochastics
- 2005Confirming piercing patterns with stochastics and moving averages
- 2006Candlestick cluster exits confirmed by overbought stochastics
- 2007Three black crows become a trade hypothesis only after regime, trend and nearby levels
- 2008Asymmetrical RSI lookbacks for divergence and candle confirmation
- 2008A permission checklist for the end of a trend
- 2010Mechanical entries still need confirmation gates
- 2010Crude oil as a case study in candlestick session reading
- 2010Gold weekly candles and the thousand resistance breakout
- 2010A three-layer gold chart drill from waves to candle confirmation
- 2011Why entry scans fail without trend filters
- 2011Price-zone oscillator trend-regime rules
- 2011A candlestick checklist before commodity entries
- 2013Step candle construction at price turning points
- 2013Two-bar step-candle construction
- 2014Small-range bars as a timed volume-climax hypothesis
- 2014Constructing volume-scaled candlestick charts
- 2015Weekly range midpoints as support and resistance
- 2015Constructing weekly body-midpoint pattern codes
- 2015Evaluating encoded candlestick sequence hypotheses
- 2015Constructing a breakout relative-strength index from two-day range candles
- 2016A three-gate classroom on hourly sterling
- 2016Fibonacci retracement as a pre-commitment stop map
- 2017Nine-zone filter for decade-level breakouts
- 2017Constructing pin-bar and inside-bar setups
- 2017Two-bar soldier and crow rules become a system only after filters and exits
- 2017Confirm a one-white-soldier or one-black-crow before entry
- 2018Session control from marubozu and engulfing geometry
- 2019Volume, acceleration, and candle filters on a completed double bottom
- 2019Sector-filtered candlestick scans and predrawn stops