2019issue C1044-45
Sector-filtered candlestick scans and predrawn stops
A historical screen first classifies index and sector trends, then isolates names that move with those shifts. Candlestick hits, exhaustion flags, and opening-gap readings stay unfinished until extra rules and a plotted stop-loss are in place.
- A three-stage screen classifies index trends, then trends in selected ETFs, industry groups, and stocks as leadership rotates, then isolates names that move with those sector shifts.
- Two of four scan rules require specified candlestick formations plus confirming trend and momentum before a directional marker is placed. Other columns flag exhaustion or classify an opening gap.
- A scan hit is not an entry. Additional criteria must still be met, and a qualified idea plots the stop-loss with the entry and target before the setup is treated as triggered.
- Sector-alignment keeps a name only when its short-, medium-, or long-term direction already matches the parent group's revision.
Classify the parent trend first
A screening sequence runs in three stages. It classifies short-, medium-, and long-term trends in selected indexes. It then classifies trends in selected ETFs, industry groups, and stocks as leadership rotates. It then isolates names that move with those sector shifts.
The sector-and-industry roster covers 14 symbols and changes a name's color when a trend revision appears versus the prior session. A filled circle background marks a trend revision since the prior session, and an arrow inside each circle states short-, medium-, or long-term direction. A name is kept through sector-alignment only when its short-, medium-, or long-term direction already matches the parent group's revision.
Four scan columns, four unfinished readings
Two of four scan rules require specified candlestick formations plus confirming trend and momentum conditions before a directional marker is placed next to the symbol. Candlestick patterns here are OHLC formations read with trend and momentum so a repeatable chart condition becomes a directional signal, not an automatic order.
A third scan marks extreme overbought or oversold exhaustion with a diamond and frames that state as a possible reversal setup. That exhaustion-marker is a flag for extreme overbought or oversold conditions used to frame a possible reversal, not to force a trade.
A fourth scan is an opening-gap-test. It reads the first five or 10 minutes of the session and posts a single arrow if a gap is expected to fill that day or a double arrow if it is not.
Choosing a scan column applies the rule across a database of more than 700 stocks, ETFs, and indexes, and each symbol chart can overlay that scan's hits for any window in the prior two years.
Index and sector returns across one year, one month, and one week
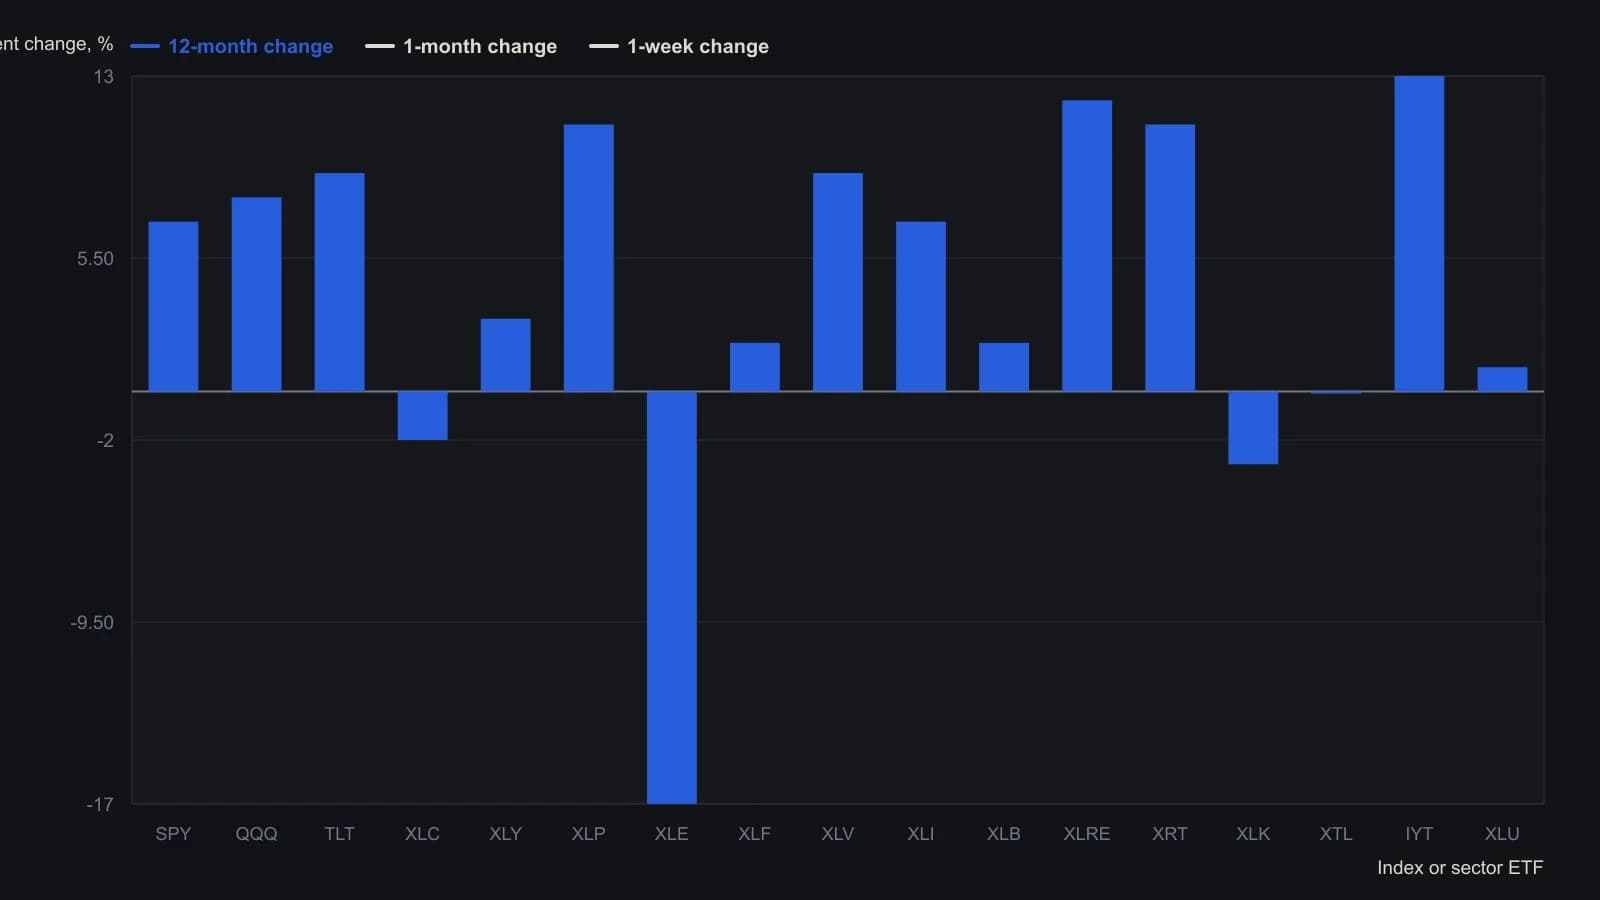
Read from the late-June 2019 screenshot of the product's sector-performance pane. Values are approximate to the nearest percent because the source does not tabulate the bars.
Turn a hit into an entry, a wait, or a pass
Rule-based entry is one procedure that converts a scan hit into an entry, a wait, or a pass only after market-state and qualification filters are also met. The scan column supplies a candidate. The rest of the procedure still has to confirm that the name remains aligned and that the extra criteria hold.
Draw the stop before the setup is live
A stop-loss is a loss bound plotted with the entry and target so exposure is capped before a qualified setup is treated as triggered. A qualified Intuit trade-idea chart plotted an entry line, a target, and a stop-loss so the risk bound existed before the setup was treated as triggered.
All readings on this track · 54 readings
- 1990Constructing three-session rally and reaction volume signals
- 1991Constructing candlestick real bodies and multi-session patterns
- 1991Treat a candlestick reversal as incomplete until %D confirms it
- 1991Filtering candlestick signals with stochastic percent-D
- 1991Constructing compressed candlestick summaries
- 1993Intraday candlestick confirmation with oscillators
- 1993Candlestick hypotheses from a 1993 reading list
- 1994License candlestick signals with oscillators and weekly vetoes
- 1995Real-body support, resistance, and close-through breakouts
- 1997Weekly reversal as a three-part hypothesis
- 1998Turning fear levels into testable rules with a psychological matrix
- 2000Evaluating three-bar reversal reliability
- 2000Prior-day candles, open confirmation, and same-session stops
- 2000Intraday candlestick volume confirmation for daytrading
- 2001Count the key reversal up before coding a mechanical exit
- 2001Rising and falling three continuation candle construction
- 2002Treat a moving average as a contested fence
- 2003Candlestick signals need support and a risk-reward screen
- 2003Constructing one-day reversal tops and bottoms
- 2003Chart sentiment as a regime filter for hourly stochastic entries
- 2004Confirming index reversals with candlesticks, stochastics and averages
- 2004The harami inner close as a reversal barometer
- 2004Constructing a true-range volume power-shift filter
- 2005Weighing reversal clusters against moving-average support
- 2005Candlestick exits confirmed by overbought stochastics
- 2005Confirming piercing patterns with stochastics and moving averages
- 2006Candlestick cluster exits confirmed by overbought stochastics
- 2007Three black crows become a trade hypothesis only after regime, trend and nearby levels
- 2008Asymmetrical RSI lookbacks for divergence and candle confirmation
- 2008A permission checklist for the end of a trend
- 2010Mechanical entries still need confirmation gates
- 2010Crude oil as a case study in candlestick session reading
- 2010Gold weekly candles and the thousand resistance breakout
- 2010A three-layer gold chart drill from waves to candle confirmation
- 2011Why entry scans fail without trend filters
- 2011Price-zone oscillator trend-regime rules
- 2011A candlestick checklist before commodity entries
- 2013Step candle construction at price turning points
- 2013Two-bar step-candle construction
- 2014Small-range bars as a timed volume-climax hypothesis
- 2014Constructing volume-scaled candlestick charts
- 2015Weekly range midpoints as support and resistance
- 2015Constructing weekly body-midpoint pattern codes
- 2015Evaluating encoded candlestick sequence hypotheses
- 2015Constructing a breakout relative-strength index from two-day range candles
- 2016A three-gate classroom on hourly sterling
- 2016Fibonacci retracement as a pre-commitment stop map
- 2017Nine-zone filter for decade-level breakouts
- 2017Constructing pin-bar and inside-bar setups
- 2017Two-bar soldier and crow rules become a system only after filters and exits
- 2017Confirm a one-white-soldier or one-black-crow before entry
- 2018Session control from marubozu and engulfing geometry
- 2019Volume, acceleration, and candle filters on a completed double bottom
- 2019Sector-filtered candlestick scans and predrawn stops