2004issue C051-3
Confirming index reversals with candlesticks, stochastics and averages
This archive lesson treats index reversal timing as a three-layer confirmation drill. A candlestick sentiment print becomes a testable hypothesis only when an oversold stochastic reading and a moving-average location check appear at the same index level.
- A candlestick bar is the net of buying, selling, and sentiment for a chosen period, and only about ten of the known signals dominate routine reversal work.
- An oversold stochastic reading at or below 20 is combined with a candlestick buy signal and a moving-average or other structural level to form a timing setup.
- The 50-day moving average is used as a location check, including the Nasdaq doji harami that printed on that average after a gap-down flush.
- The January and February 2004 index case study used late-January topping candles to illustrate short-side exposure and early-February bottoming candles to illustrate covering shorts and turning long.
A three-layer confirmation drill
TradersWeek editorial reading: reversal timing is taught here as a three-layer confirmation drill. A candlestick sentiment print is treated as a falsifiable hypothesis only when an oversold stochastic threshold and a moving-average location check fire at the same index level.
The archive presents a candlestick bar as the net of buying, selling, and sentiment for a trading entity over a chosen time period. Candlestick signals are described as visual records of recurring fear-and-greed behavior at reversal points, developed through long observational practice rather than computer backtests.
The candlestick layer
About 50 candlestick signals have been identified, but roughly 10 recur often enough to dominate routine work. That working set includes the doji, bullish and bearish engulfing, hanging man, shooting star, hammer, bullish and bearish harami, dark cloud, piercing pattern, and kicker.
A doji is a candle with nearly equal open and close, treated as indecision and as a cue that the next session may travel in the direction of its open. A harami is a smaller real body inside the prior candle's range, read here as selling that has stalled.
The stochastic and average layers
An oversold condition is defined as a stochastic reading at or below 20. That reading is combined with a candlestick buy signal plus a moving-average or other structural level to form a timing setup.
The stochastic oscillator is a bounded oscillator of recent closes versus the local high-low range, used here as an exhaustion filter when readings fall to or below 20. The moving average is a smoothed price baseline. In the case study the 50-day average is the location check for a potential turning point.
Late January topping on the Nasdaq
In late January 2004 the Nasdaq Composite sold off after a doji, a hanging man, and a bearish engulfing pattern, then broke the recent range low on a subsequent hard-sell day. The January and February 2004 index case study used those late-January topping candles to illustrate short-side exposure.
The early February pause and turn
After a week-long Nasdaq decline, a gap down printed while the stochastic oscillator was oversold, and that session closed near the 50-day moving average. A gap-down is a session that opens below the prior range; in a decline it is treated as a possible panic flush near a low.
The next day a doji harami formed on the same 50-day average. The harami is treated as evidence that selling has paused, and the stated rule is that the session after a doji often continues in the direction of its open. Early-February bottoming candles, including that Nasdaq doji harami on the 50-day average, were used to illustrate covering shorts and turning long.
A parallel pause on the Dow
The Dow Jones Industrial Average spent six days near 10500 printing dojis, spinning tops, and hammers while stochastics flattened in oversold territory and then turned up.
How the archive frames the method
Candlestick signals remain visual records of recurring fear-and-greed behavior rather than computer-tested forecasts. TradersWeek editorial reading: the value of the drill is the joint condition at one index level, not any single print, oscillator reading, or average touch.
Nasdaq Composite daily close and 50-day average
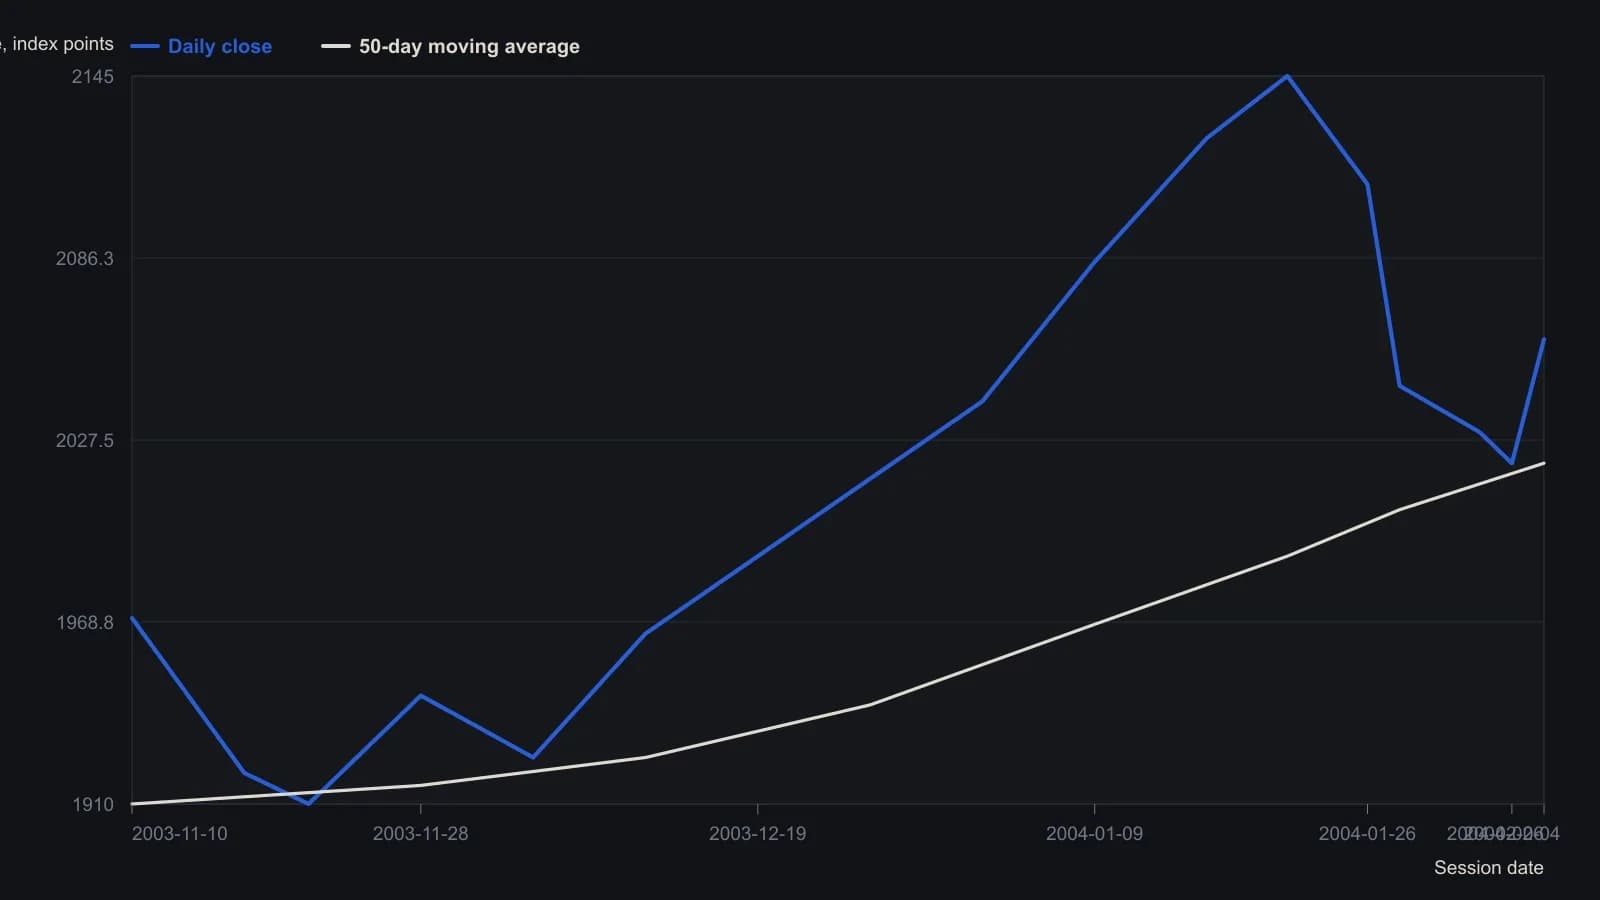
CQG marked the vertical scale in tens (printed 206 = 2,060 index points). Digitized closes are visual readings to the nearest five points and do not preserve doji or harami shape. Early session dates follow the companion Dow pane’s November–February axis and the article’s late-January / first-week-of-February timing.
All readings on this track · 54 readings
- 1990Constructing three-session rally and reaction volume signals
- 1991Constructing candlestick real bodies and multi-session patterns
- 1991Treat a candlestick reversal as incomplete until %D confirms it
- 1991Filtering candlestick signals with stochastic percent-D
- 1991Constructing compressed candlestick summaries
- 1993Intraday candlestick confirmation with oscillators
- 1993Candlestick hypotheses from a 1993 reading list
- 1994License candlestick signals with oscillators and weekly vetoes
- 1995Real-body support, resistance, and close-through breakouts
- 1997Weekly reversal as a three-part hypothesis
- 1998Turning fear levels into testable rules with a psychological matrix
- 2000Evaluating three-bar reversal reliability
- 2000Prior-day candles, open confirmation, and same-session stops
- 2000Intraday candlestick volume confirmation for daytrading
- 2001Count the key reversal up before coding a mechanical exit
- 2001Rising and falling three continuation candle construction
- 2002Treat a moving average as a contested fence
- 2003Candlestick signals need support and a risk-reward screen
- 2003Constructing one-day reversal tops and bottoms
- 2003Chart sentiment as a regime filter for hourly stochastic entries
- 2004Confirming index reversals with candlesticks, stochastics and averages
- 2004The harami inner close as a reversal barometer
- 2004Constructing a true-range volume power-shift filter
- 2005Weighing reversal clusters against moving-average support
- 2005Candlestick exits confirmed by overbought stochastics
- 2005Confirming piercing patterns with stochastics and moving averages
- 2006Candlestick cluster exits confirmed by overbought stochastics
- 2007Three black crows become a trade hypothesis only after regime, trend and nearby levels
- 2008Asymmetrical RSI lookbacks for divergence and candle confirmation
- 2008A permission checklist for the end of a trend
- 2010Mechanical entries still need confirmation gates
- 2010Crude oil as a case study in candlestick session reading
- 2010Gold weekly candles and the thousand resistance breakout
- 2010A three-layer gold chart drill from waves to candle confirmation
- 2011Why entry scans fail without trend filters
- 2011Price-zone oscillator trend-regime rules
- 2011A candlestick checklist before commodity entries
- 2013Step candle construction at price turning points
- 2013Two-bar step-candle construction
- 2014Small-range bars as a timed volume-climax hypothesis
- 2014Constructing volume-scaled candlestick charts
- 2015Weekly range midpoints as support and resistance
- 2015Constructing weekly body-midpoint pattern codes
- 2015Evaluating encoded candlestick sequence hypotheses
- 2015Constructing a breakout relative-strength index from two-day range candles
- 2016A three-gate classroom on hourly sterling
- 2016Fibonacci retracement as a pre-commitment stop map
- 2017Nine-zone filter for decade-level breakouts
- 2017Constructing pin-bar and inside-bar setups
- 2017Two-bar soldier and crow rules become a system only after filters and exits
- 2017Confirm a one-white-soldier or one-black-crow before entry
- 2018Session control from marubozu and engulfing geometry
- 2019Volume, acceleration, and candle filters on a completed double bottom
- 2019Sector-filtered candlestick scans and predrawn stops