1998issue C081-8
Turning fear levels into testable rules with a psychological matrix
A psychological matrix converts subjective market emotion into defined fear states, maps those states onto price structure, and lets a four-bar candlestick sequence be coded as one mechanical trading procedure.
- A psychological matrix converts subjective market emotion into defined states that can be coded as studies, flow charts, indicators, or complete trading procedures.
- Fear is the primary emotion to model and is located near extremes of price, where it drives fluctuations around an average price that matter for entry and exit timing.
- High-to-high relations mark the shift from bull bias to bull fear, low-to-low relations mark the shift from bear bias to bear fear, and the mean of those two levels locates the point of balance.
- A four-bar fear pattern can be coded as a mechanical system and checked with no stops and without sample-specific optimization, including through grid testing across many instruments.
A matrix for coding market emotion
A psychological matrix is a defined set of emotional market states that can be observed, measured, and turned into testable trading rules. It is presented as a way to convert subjective market emotion into defined states that can be coded as studies, flow charts, indicators, or complete trading procedures.
Statistics are treated as classified numerical milestones. Knowledge is treated as the ability to analyze those observations and apply them to the right side of the chart.
Fear as the primary modelled emotion
Fear is isolated as the primary emotion to model. Anger and anxiety are treated as secondary self-preservation responses that appear after a trade goes wrong or a winner is exited too soon.
Fear is located near extremes of price. It is described as driving fluctuations around an average price that matter for entry and exit timing.
Primary and secondary fear levels
The matrix defines three primary fear levels: bull fear, point of balance, and bear fear. It also defines four secondary levels: overbought, bull bias, bear bias, and oversold.
Bull fear is a rising-market state in which buyers chase participation and short sellers rush to cover. Bear fear is a declining-market state in which sellers chase participation and buyers rush to exit. The point of balance is the indecision zone between bull fear and bear fear.
Mapping fear states onto price structure
High-to-high relations are used to mark the shift from bull bias to bull fear. Low-to-low relations are used to mark the shift from bear bias to bear fear.
The mean of those two levels locates the point of balance. That point of balance is treated as a mean of the two fear-derived levels.
Treasury bond futures with bull-fear and bear-fear envelopes
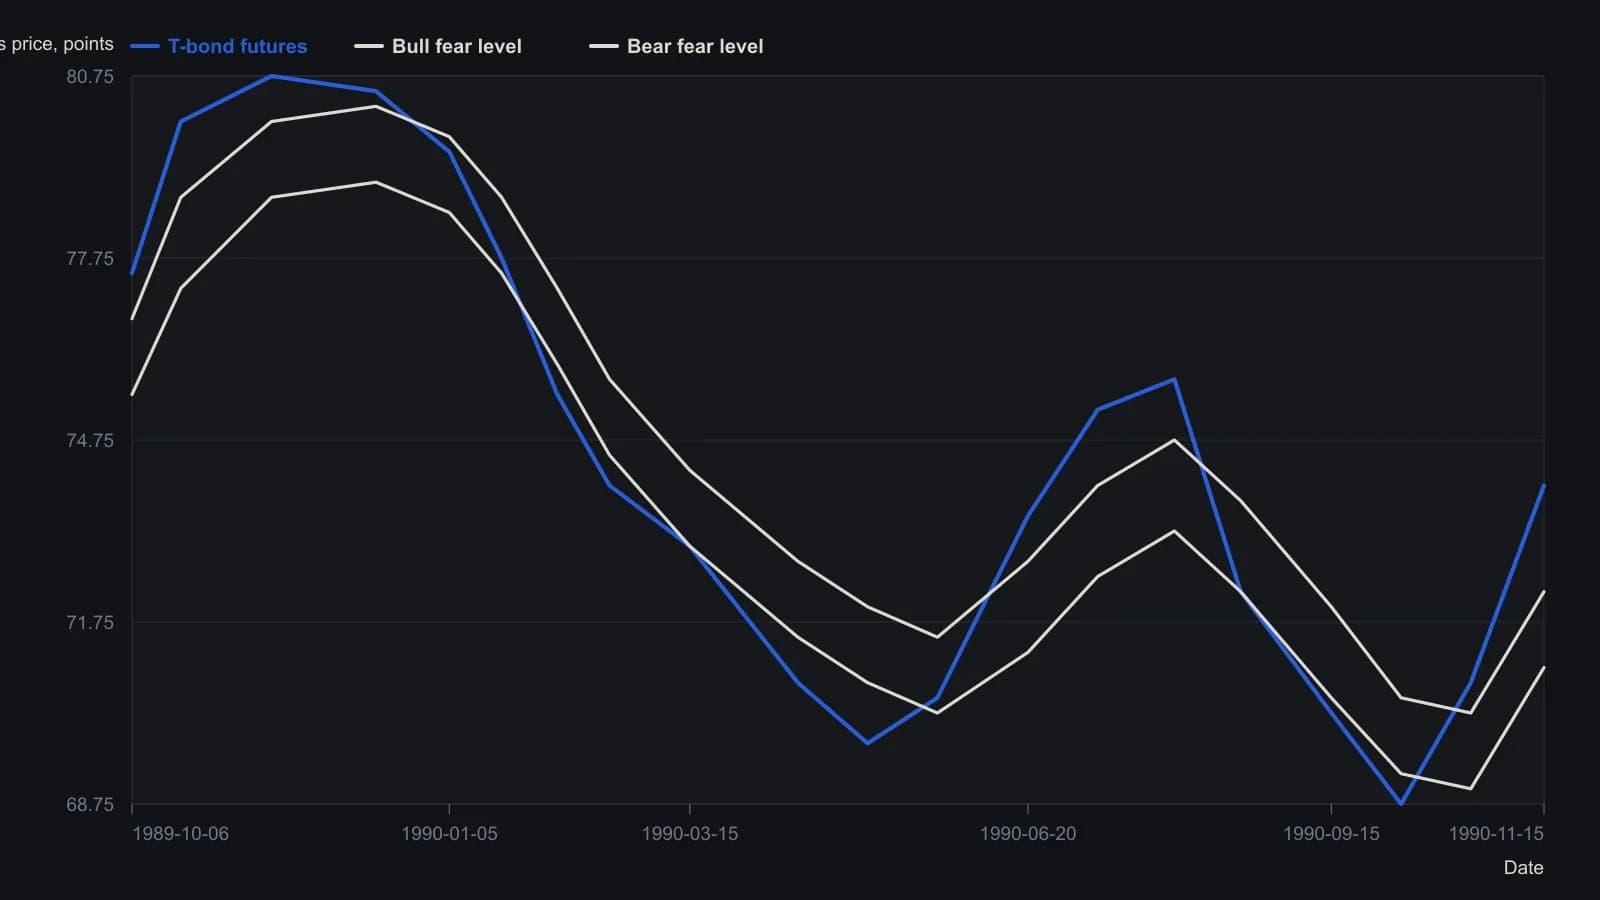
Sampled from the raster at roughly two-week steps. Quotes converted from 32nds to decimal points. Daily OHLC was not recovered; this is the outline of typical price and of the two outer fear lines, good to about a quarter-point.
A four-bar fear pattern as one procedure
A four-bar fear pattern is a short candlestick sequence used to mark a fear-state transition that can be coded as a complete signal procedure. The sequence was coded as a mechanical system.
The procedure was initially checked with no stops and without optimizing the rules to the test sample.
How the rules were checked
Long single-market tests over 10 or 20 years are contrasted with grid testing. Grid testing evaluates a rule set across many markets on limited history per instrument instead of optimizing one contract over a long single-market sample.
That grid is typically described as about 25 futures markets and 200 stocks, with only a few years of data per instrument.
Chart examples of four-bar fear signals in coffee, soybeans, heating oil, and the Canadian dollar were used to argue that the original exit rule was too tight and left unused follow-through on the table.
All readings on this track · 54 readings
- 1990Constructing three-session rally and reaction volume signals
- 1991Constructing candlestick real bodies and multi-session patterns
- 1991Treat a candlestick reversal as incomplete until %D confirms it
- 1991Filtering candlestick signals with stochastic percent-D
- 1991Constructing compressed candlestick summaries
- 1993Intraday candlestick confirmation with oscillators
- 1993Candlestick hypotheses from a 1993 reading list
- 1994License candlestick signals with oscillators and weekly vetoes
- 1995Real-body support, resistance, and close-through breakouts
- 1997Weekly reversal as a three-part hypothesis
- 1998Turning fear levels into testable rules with a psychological matrix
- 2000Evaluating three-bar reversal reliability
- 2000Prior-day candles, open confirmation, and same-session stops
- 2000Intraday candlestick volume confirmation for daytrading
- 2001Count the key reversal up before coding a mechanical exit
- 2001Rising and falling three continuation candle construction
- 2002Treat a moving average as a contested fence
- 2003Candlestick signals need support and a risk-reward screen
- 2003Constructing one-day reversal tops and bottoms
- 2003Chart sentiment as a regime filter for hourly stochastic entries
- 2004Confirming index reversals with candlesticks, stochastics and averages
- 2004The harami inner close as a reversal barometer
- 2004Constructing a true-range volume power-shift filter
- 2005Weighing reversal clusters against moving-average support
- 2005Candlestick exits confirmed by overbought stochastics
- 2005Confirming piercing patterns with stochastics and moving averages
- 2006Candlestick cluster exits confirmed by overbought stochastics
- 2007Three black crows become a trade hypothesis only after regime, trend and nearby levels
- 2008Asymmetrical RSI lookbacks for divergence and candle confirmation
- 2008A permission checklist for the end of a trend
- 2010Mechanical entries still need confirmation gates
- 2010Crude oil as a case study in candlestick session reading
- 2010Gold weekly candles and the thousand resistance breakout
- 2010A three-layer gold chart drill from waves to candle confirmation
- 2011Why entry scans fail without trend filters
- 2011Price-zone oscillator trend-regime rules
- 2011A candlestick checklist before commodity entries
- 2013Step candle construction at price turning points
- 2013Two-bar step-candle construction
- 2014Small-range bars as a timed volume-climax hypothesis
- 2014Constructing volume-scaled candlestick charts
- 2015Weekly range midpoints as support and resistance
- 2015Constructing weekly body-midpoint pattern codes
- 2015Evaluating encoded candlestick sequence hypotheses
- 2015Constructing a breakout relative-strength index from two-day range candles
- 2016A three-gate classroom on hourly sterling
- 2016Fibonacci retracement as a pre-commitment stop map
- 2017Nine-zone filter for decade-level breakouts
- 2017Constructing pin-bar and inside-bar setups
- 2017Two-bar soldier and crow rules become a system only after filters and exits
- 2017Confirm a one-white-soldier or one-black-crow before entry
- 2018Session control from marubozu and engulfing geometry
- 2019Volume, acceleration, and candle filters on a completed double bottom
- 2019Sector-filtered candlestick scans and predrawn stops