2008issue C101-5
Asymmetrical RSI lookbacks for divergence and candle confirmation
A standard relative strength index averages up-close and down-close changes with one shared length and rescales relative strength onto a 0-100 oscillator. An asymmetrical RSI uses side-specific smoothing, which produced extra 30 and 70 swings and extra mismatches that were then accepted or rejected with candlestick confirmation and nearby structure.
- The relative strength index splits one-bar close changes into up and down series, averages both sides, forms relative strength, and rescales that ratio onto a 0-100 oscillator.
- In the standard construction both sides share one averaging length, so that length does not depend on how many bars in the window closed higher versus lower.
- Asymmetrical RSI applies side-specific smoothing, which crossed the overbought-oversold bands more often and printed extra normal divergence and hidden divergence cases.
- Those extra mismatches were kept or deferred only after candlestick confirmation against support, resistance, and trendline breaks.
One averaging length for both sides
The standard relative strength index splits one-bar close changes into an up series and a down series, averages each side, forms relative strength as the up average divided by the down average, and rescales that ratio onto a 0-100 oscillator.
In that construction both sides share one averaging length. The length is independent of how many bars in the window closed higher versus lower.
A 14-bar reading is treated as oversold below 30 and overbought above 70. Those overbought-oversold bands mark stretched oscillator extremes rather than standalone trade instructions. A mismatch between oscillator direction and price direction is presented as a primary use of the indicator.
Four specified mismatches
Four mismatch cases are specified. A higher oscillator low against a lower price low, and a lower oscillator high against a higher price high, are opposite swing extremes at the end of a decline or an advance. That pairing is normal divergence, read as a possible reversal condition.
A lower oscillator low against a higher price low after a pullback in an advance, and a higher oscillator high against a lower price high after a bounce in a decline, are labeled reverse or hidden. Hidden divergence is read as a possible continuation condition after a pullback or bounce inside an existing trend.
Side-specific smoothing
The asymmetrical RSI keeps the same 0-100 scale. Inside the chosen window it counts up-closes that are equal to or higher than the prior close, sets the down count as the window length minus that count, and smooths each side with an exponential average of twice its own count minus 1 before forming relative strength and the oscillator.
That is side-specific smoothing. The two sides no longer share one window.
Extra band swings as a checklist
On the illustrated comparison the asymmetrical 14-bar line crossed 70 and 30 more often than the standard 14-bar line, while the broad up and down swings stayed similar. The write-up treats that as earlier short-horizon turning-point visibility at the cost of a more volatile oscillator.
On a daily index comparison the asymmetrical line printed regular divergences that were absent or less distinct on the standard 14-bar line: lower oscillator highs against rising price, and higher oscillator lows against a new price low after a drop below 30.
The same index series also showed additional hidden mismatches, including lower oscillator lows against higher price lows after a mid-advance correction, which were not visible on the standard line.
The modification is described as usable on more than one time frame, with the largest visual gap versus the standard oscillator on daily and minute charts. An editorial view is that the extra 30 and 70 swings belong on a checklist of candidate divergences, not as standalone instructions.
Candlestick confirmation
In a multi-month equity walk-through, extra asymmetrical divergences were read only with candlestick reversal structures: doji, tweezer tops, evening star, morning star, and an engulfing that began with a doji. Those readings were taken together with support, resistance, and trendline breaks.
One clustered setup was still deferred because nearby resistance left an unfavorable distance from a support-based stop to the first overhead barrier.
HPQ daily price returning to the July shelf
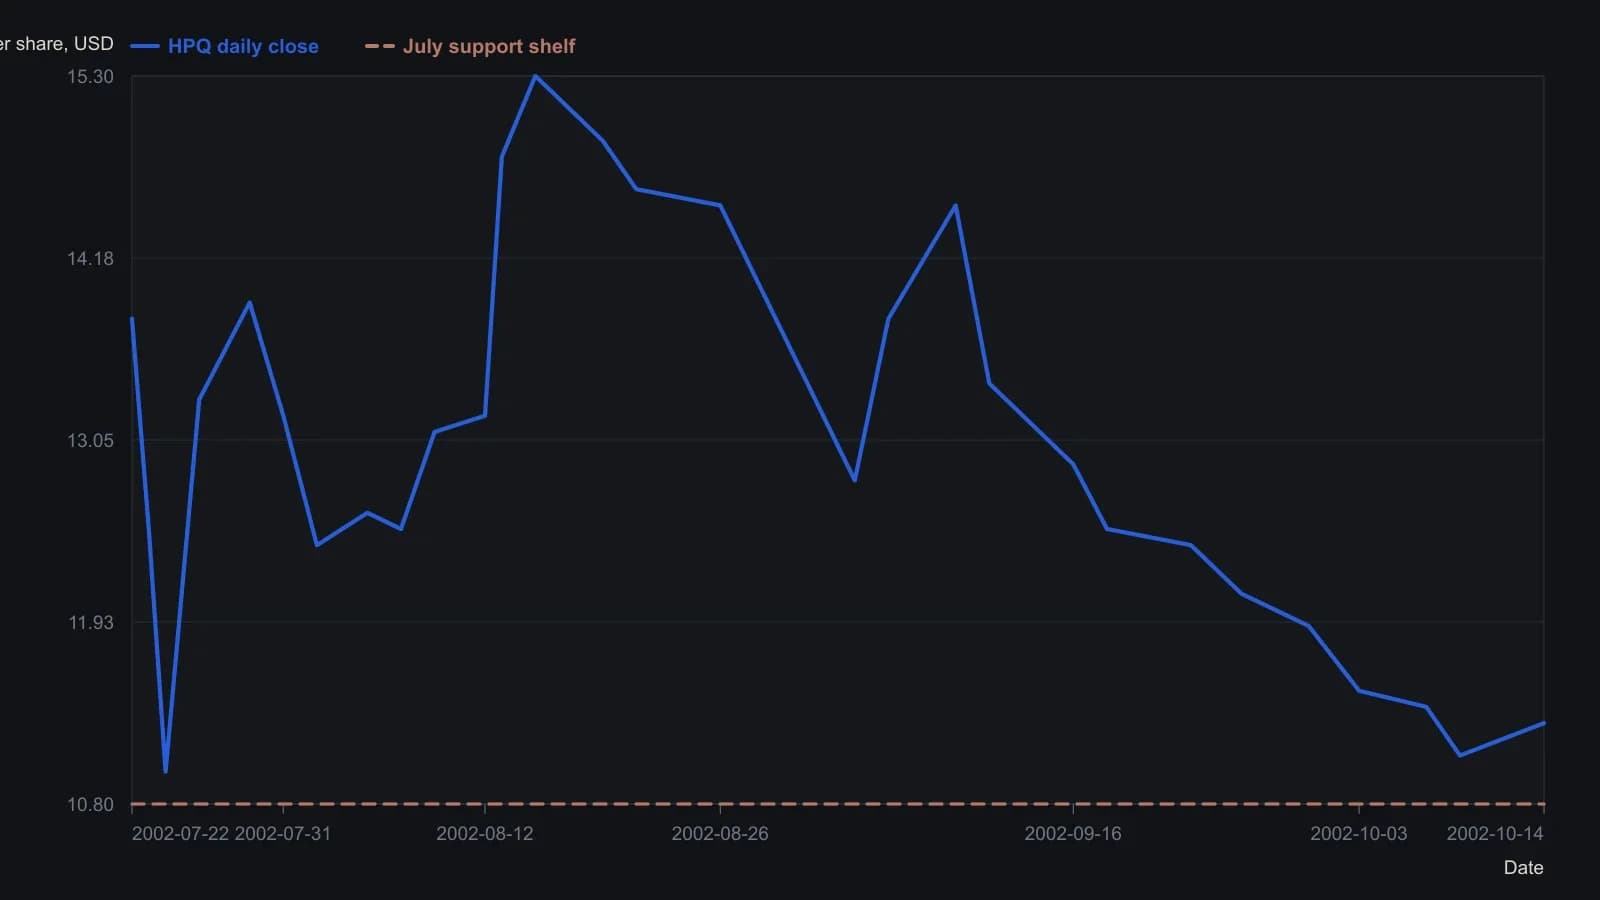
Digitized from daily candlesticks at roughly 0.1-dollar resolution. The pane prints month and day only; 2002 is the tape that matches these dollar levels and the session mark on 3 September after the Labor Day close. The red line sits near 10.8, a slightly lower shelf than the $11.90 support named in the text.
All readings on this track · 54 readings
- 1990Constructing three-session rally and reaction volume signals
- 1991Constructing candlestick real bodies and multi-session patterns
- 1991Treat a candlestick reversal as incomplete until %D confirms it
- 1991Filtering candlestick signals with stochastic percent-D
- 1991Constructing compressed candlestick summaries
- 1993Intraday candlestick confirmation with oscillators
- 1993Candlestick hypotheses from a 1993 reading list
- 1994License candlestick signals with oscillators and weekly vetoes
- 1995Real-body support, resistance, and close-through breakouts
- 1997Weekly reversal as a three-part hypothesis
- 1998Turning fear levels into testable rules with a psychological matrix
- 2000Evaluating three-bar reversal reliability
- 2000Prior-day candles, open confirmation, and same-session stops
- 2000Intraday candlestick volume confirmation for daytrading
- 2001Count the key reversal up before coding a mechanical exit
- 2001Rising and falling three continuation candle construction
- 2002Treat a moving average as a contested fence
- 2003Candlestick signals need support and a risk-reward screen
- 2003Constructing one-day reversal tops and bottoms
- 2003Chart sentiment as a regime filter for hourly stochastic entries
- 2004Confirming index reversals with candlesticks, stochastics and averages
- 2004The harami inner close as a reversal barometer
- 2004Constructing a true-range volume power-shift filter
- 2005Weighing reversal clusters against moving-average support
- 2005Candlestick exits confirmed by overbought stochastics
- 2005Confirming piercing patterns with stochastics and moving averages
- 2006Candlestick cluster exits confirmed by overbought stochastics
- 2007Three black crows become a trade hypothesis only after regime, trend and nearby levels
- 2008Asymmetrical RSI lookbacks for divergence and candle confirmation
- 2008A permission checklist for the end of a trend
- 2010Mechanical entries still need confirmation gates
- 2010Crude oil as a case study in candlestick session reading
- 2010Gold weekly candles and the thousand resistance breakout
- 2010A three-layer gold chart drill from waves to candle confirmation
- 2011Why entry scans fail without trend filters
- 2011Price-zone oscillator trend-regime rules
- 2011A candlestick checklist before commodity entries
- 2013Step candle construction at price turning points
- 2013Two-bar step-candle construction
- 2014Small-range bars as a timed volume-climax hypothesis
- 2014Constructing volume-scaled candlestick charts
- 2015Weekly range midpoints as support and resistance
- 2015Constructing weekly body-midpoint pattern codes
- 2015Evaluating encoded candlestick sequence hypotheses
- 2015Constructing a breakout relative-strength index from two-day range candles
- 2016A three-gate classroom on hourly sterling
- 2016Fibonacci retracement as a pre-commitment stop map
- 2017Nine-zone filter for decade-level breakouts
- 2017Constructing pin-bar and inside-bar setups
- 2017Two-bar soldier and crow rules become a system only after filters and exits
- 2017Confirm a one-white-soldier or one-black-crow before entry
- 2018Session control from marubozu and engulfing geometry
- 2019Volume, acceleration, and candle filters on a completed double bottom
- 2019Sector-filtered candlestick scans and predrawn stops