2005issue C011-3
Weighing reversal clusters against moving-average support
A biotechnology sector proxy was framed as a near-term reversal case on divergence, failed follow-through, and a late-rally shooting star, with moving-average confluence as the main counterargument. The same checklist can be rerun on individual names to see which confirm the proxy and which dissent.
- Put a negative stochastic divergence, a one-two-three reversal, a failed-new-high test, and a late-rally shooting star on the reversal side of the ledger.
- Put moving-average confluence just below the lows then in place on the other side, especially when later declines respect averages that were ignored during the advance.
- Treat a negative stochastic divergence as a warning that upside momentum is fading, even when it is difficult to trade in a strong uptrend.
- Run a constituent audit with the same oscillator, average, and candlestick checks to see which names confirm the sector proxy and which dissent.
Keep a ledger, not a single mark
Editorial note: a crowded sector chart is easier to handle as a two-column ledger than as one combined signal. Put oscillator divergence, failed-follow-through structure, and late-rally candlesticks on one side. Put stacked moving-average support on the other. Then rerun the same checklist on individual names to see which confirm the sector proxy and which dissent.
The archive framed a near-term reversal case for a biotechnology sector proxy around four developments: a running negative stochastic divergence, a one-two-three reversal, a failed-new-high test, and a shooting star. Clustered moving-average support was presented as the main counterargument.
The reversal column
A stochastic oscillator on that proxy was described as peaking and then marking lower highs while the proxy printed higher peaks over the same span. That pairing is a negative stochastic divergence: the oscillator prints lower highs while price prints higher highs, treated as a warning that upside momentum is fading.
Negative stochastic divergences were characterized as difficult to trade during strong uptrends, yet still treated as warnings of possible weakness or reversal.
The one-two-three reversal was specified as a broken uptrend line, a failed attempt to retake the old trend, and a later test of the post-break low. The proxy was said to have shown the first two stages after a trendline break and to be approaching the third.
A failed-new-high test is a reversal hypothesis that forms when price makes a new high but does not immediately continue higher. A shooting star with a long upper shadow and a small real body was identified on the bar that also marked the failed retest in the one-two-three reversal and a later higher high of that failed-new-high test. Late in an advance, the shooting star is read as a failed push by buyers.
The support column
Just below the lows then in place, a short-lookback exponential average was paired with an intermediate exponential average and a long simple average sitting close together. That bunching is moving-average confluence: a zone where short, intermediate, and long lookbacks may act as a shared support shelf.
Those averages were described as having halted later declines even though the proxy had largely ignored them earlier in the advance. In a later correction the short average was penetrated while the longer averages still held.
BBH daily closes against the 20-, 50- and 200-day averages
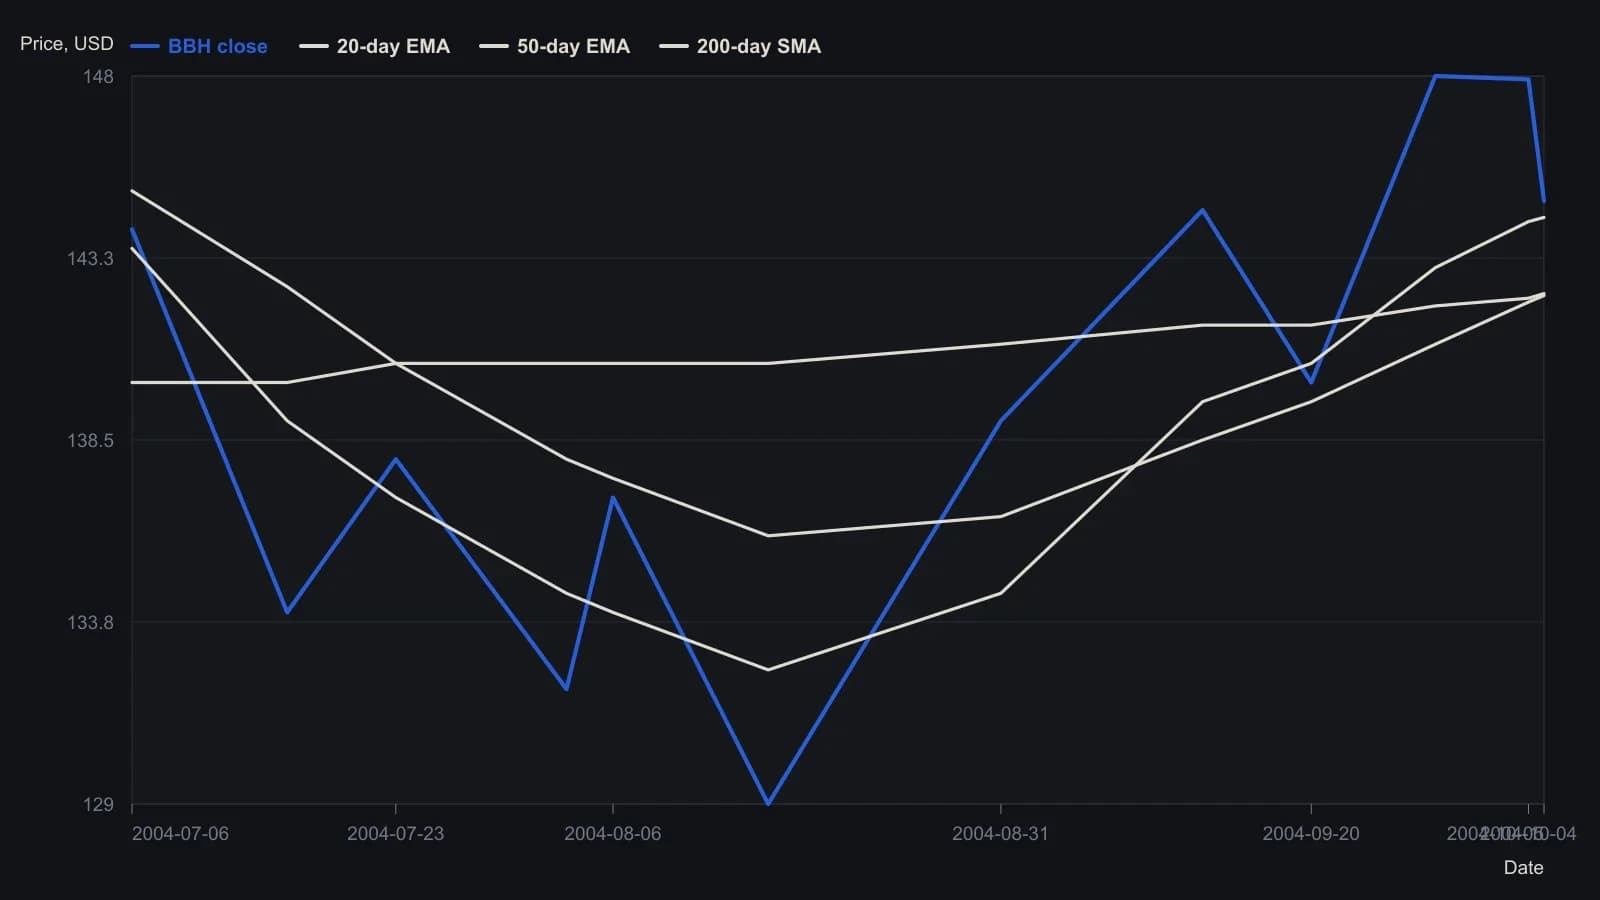
Header OHLC and moving-average last values are exact. Earlier points are digitized from the daily candlestick raster to about a half dollar and are approximate. The steep rising line and the horizontal line near 148 on the source image are drawn annotations, not averages, and are omitted. The 4 October close of 147.91 is the printed session change of 3.17 added back to the 5 October close.
Which names confirm the proxy
Individual biotechnology names were presented as mixed. Some remained above major averages with stochastic peaks matching price. Others traded below those averages and showed negative stochastic divergences or weak upper shadows.
One constituent was described as extended from its intermediate exponential average but lacking a negative stochastic divergence after a run of consecutive up days. Another traded below its short, intermediate, and long averages and printed a doji. Here the doji is an indecision mark that can reinforce a weak context when price is already below its major averages.
Repeating those oscillator, average, and candlestick checks is a constituent audit. It shows which names confirm the sector proxy and which contradict it.
All readings on this track · 54 readings
- 1990Constructing three-session rally and reaction volume signals
- 1991Constructing candlestick real bodies and multi-session patterns
- 1991Treat a candlestick reversal as incomplete until %D confirms it
- 1991Filtering candlestick signals with stochastic percent-D
- 1991Constructing compressed candlestick summaries
- 1993Intraday candlestick confirmation with oscillators
- 1993Candlestick hypotheses from a 1993 reading list
- 1994License candlestick signals with oscillators and weekly vetoes
- 1995Real-body support, resistance, and close-through breakouts
- 1997Weekly reversal as a three-part hypothesis
- 1998Turning fear levels into testable rules with a psychological matrix
- 2000Evaluating three-bar reversal reliability
- 2000Prior-day candles, open confirmation, and same-session stops
- 2000Intraday candlestick volume confirmation for daytrading
- 2001Count the key reversal up before coding a mechanical exit
- 2001Rising and falling three continuation candle construction
- 2002Treat a moving average as a contested fence
- 2003Candlestick signals need support and a risk-reward screen
- 2003Constructing one-day reversal tops and bottoms
- 2003Chart sentiment as a regime filter for hourly stochastic entries
- 2004Confirming index reversals with candlesticks, stochastics and averages
- 2004The harami inner close as a reversal barometer
- 2004Constructing a true-range volume power-shift filter
- 2005Weighing reversal clusters against moving-average support
- 2005Candlestick exits confirmed by overbought stochastics
- 2005Confirming piercing patterns with stochastics and moving averages
- 2006Candlestick cluster exits confirmed by overbought stochastics
- 2007Three black crows become a trade hypothesis only after regime, trend and nearby levels
- 2008Asymmetrical RSI lookbacks for divergence and candle confirmation
- 2008A permission checklist for the end of a trend
- 2010Mechanical entries still need confirmation gates
- 2010Crude oil as a case study in candlestick session reading
- 2010Gold weekly candles and the thousand resistance breakout
- 2010A three-layer gold chart drill from waves to candle confirmation
- 2011Why entry scans fail without trend filters
- 2011Price-zone oscillator trend-regime rules
- 2011A candlestick checklist before commodity entries
- 2013Step candle construction at price turning points
- 2013Two-bar step-candle construction
- 2014Small-range bars as a timed volume-climax hypothesis
- 2014Constructing volume-scaled candlestick charts
- 2015Weekly range midpoints as support and resistance
- 2015Constructing weekly body-midpoint pattern codes
- 2015Evaluating encoded candlestick sequence hypotheses
- 2015Constructing a breakout relative-strength index from two-day range candles
- 2016A three-gate classroom on hourly sterling
- 2016Fibonacci retracement as a pre-commitment stop map
- 2017Nine-zone filter for decade-level breakouts
- 2017Constructing pin-bar and inside-bar setups
- 2017Two-bar soldier and crow rules become a system only after filters and exits
- 2017Confirm a one-white-soldier or one-black-crow before entry
- 2018Session control from marubozu and engulfing geometry
- 2019Volume, acceleration, and candle filters on a completed double bottom
- 2019Sector-filtered candlestick scans and predrawn stops