2017issue C1050-56
Two-bar soldier and crow rules become a system only after filters and exits
A two-bar soldier or crow highlight is not yet an entry and exit system. This archive case study shows how coded Boolean functions, a liquidity-filter, oscillator-exit rules, and a scanner-study turn that chart condition into a hypothesis that can later be falsified.
- The featured technique shortens three-white-soldiers and three-black-crows into two-bar one-white-soldier and one-black-crow definitions so the reversal highlight can fire more often.
- A liquidity-filter keeps soldier setups only if the close is at least 1 and crow setups only if the close is at least 10, and both need 50-bar average volume of at least 100000.
- Long and short exit stacks close on a price-structure-exit, an oscillator-exit from the 14-period stochastic or 14-period RSI, and optional-stops of 3 percent and 5 percent.
- Editorial reading: the candlestick condition is a complete system only after those pieces are written so the same scan can later be shown to be wrong.
A two-bar highlight is not yet a system
The featured technique shortens the classic three-white-soldiers and three-black-crows sequences into two-bar soldier and crow definitions. The shorter one-white-soldier and one-black-crow conditions can fire more often and be used as a reversal highlight.
That highlight is only the first clause of an entry and exit system. The archive workflow then writes explicit scan gates, oscillator exits, and a scan that records what happened after the setup.
How the soldier and crow Booleans are coded
A one-white-soldier is a two-bar bullish reversal: a down-close bar, then an engulfing-style up bar that opens inside the prior body and closes above the prior open, after a short run of lower closes.
The coded soldier Boolean requires a prior down-close after two lower closes, then an up bar that opens above that prior close, closes above that prior open, and opens below that prior open.
A one-black-crow is the bearish counterpart: an up-close bar, then an engulfing-style down bar that opens inside the prior body and closes below the prior open, after a short run of higher closes.
The coded crow Boolean requires a prior up-close after two higher closes, then a down bar that opens below that prior close, closes below that prior open, and opens above that prior open.
Scan gates, a scanner-study, and a paintbar-study
Default scan gates apply a liquidity-filter so the list keeps reasonably traded names. Soldier setups are kept only if the close is at least 1. Crow setups are kept only if the close is at least 10. Both also require 50-bar average volume of at least 100000.
One scanner-study records the setup close and bar. On the last bar it plots percent change from that close, bars elapsed, and whether the last pattern was a soldier or a crow.
A paintbar-study companion colors soldier bars one hue and crow bars another. The same Boolean functions can then be inspected on a chart instead of only in a scan list.
Written exits complete the long and short stacks
A complete long exit stack closes at market after two lower lows. That price-structure-exit sits beside an oscillator-exit: the stack also closes if the 14-period stochastic is at or above 80 or the 14-period RSI is at or above 70. Optional-stops overlay a 3 percent stop-loss and a 5 percent take-profit on the same candle-plus-oscillator skeleton.
The matching short exit stack covers at market after two higher highs. The oscillator-exit covers if the 14-period stochastic is at or below 20 or the 14-period RSI is at or below 30. The same optional 3 percent and 5 percent overlays apply.
Average per-trade profit of one-white-soldier longs versus SPX
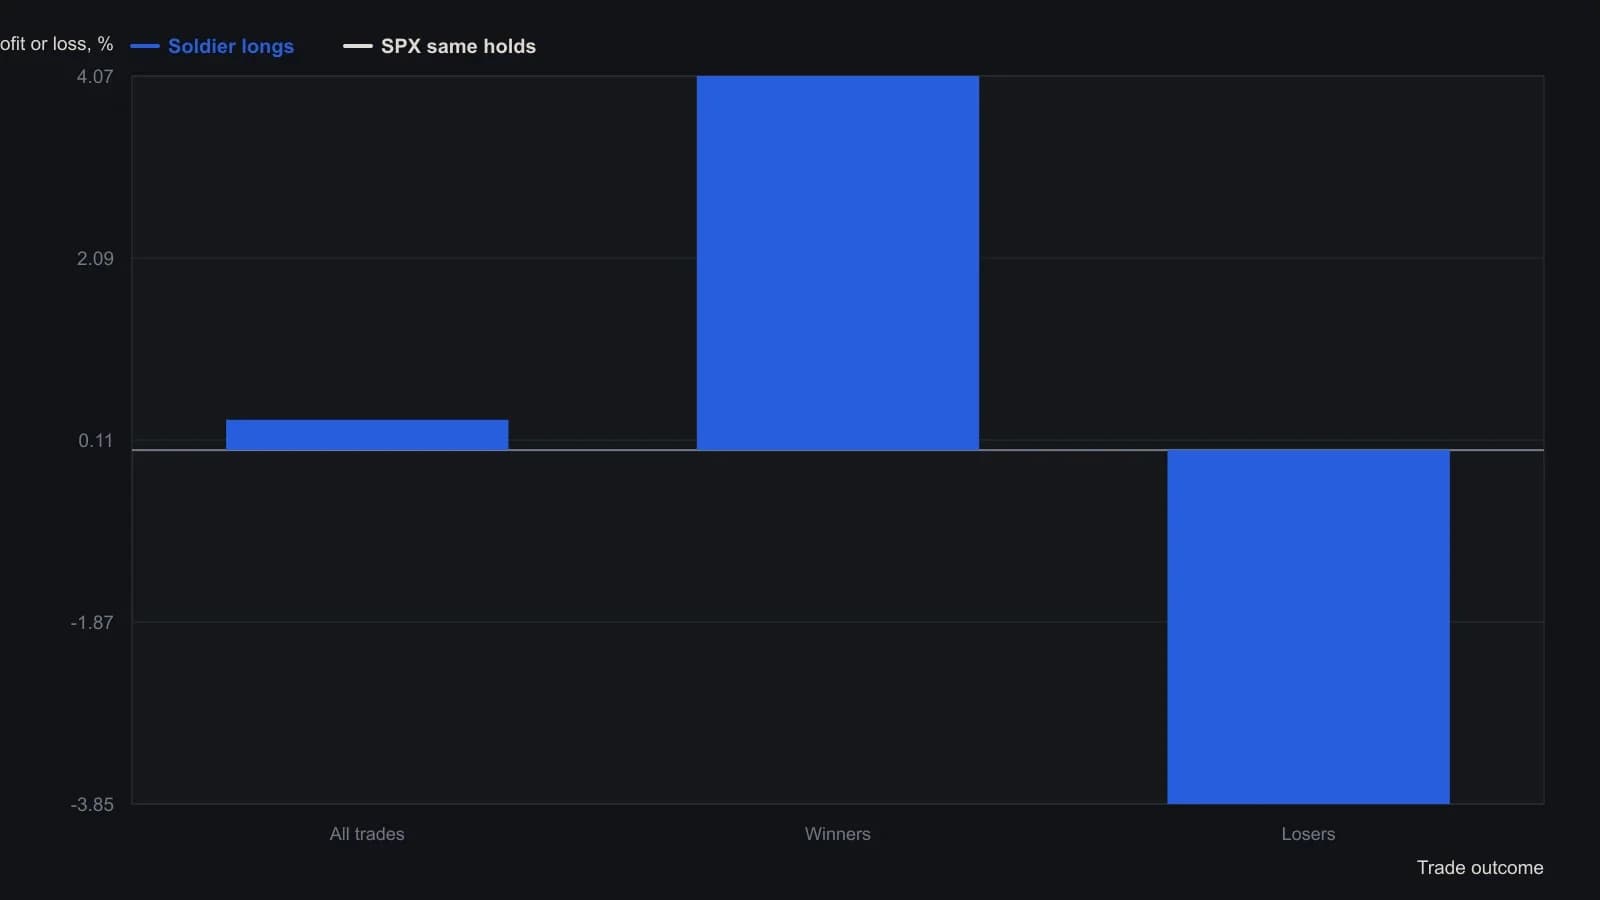
AIQ selected dayCount 5 and a seven-bar time exit as the best long parameters on the Nasdaq-100 list (NAS10017). Entry and exit are at the open. Commission and slippage were not subtracted; three trades are neither winners nor losers (open positions).
Reusable functions make the hypothesis checkable
Multiple platform ports treat the same two-bar rules as reusable functions, exploration filters, or chart studies. A reader can turn the candlestick condition into a coded, checkable hypothesis instead of a one-off chart note.
Editorial interpretation: filters, exits, and a scanner-study are what make the two-bar highlight a system, because those written pieces can later be falsified.
All readings on this track · 54 readings
- 1990Constructing three-session rally and reaction volume signals
- 1991Constructing candlestick real bodies and multi-session patterns
- 1991Treat a candlestick reversal as incomplete until %D confirms it
- 1991Filtering candlestick signals with stochastic percent-D
- 1991Constructing compressed candlestick summaries
- 1993Intraday candlestick confirmation with oscillators
- 1993Candlestick hypotheses from a 1993 reading list
- 1994License candlestick signals with oscillators and weekly vetoes
- 1995Real-body support, resistance, and close-through breakouts
- 1997Weekly reversal as a three-part hypothesis
- 1998Turning fear levels into testable rules with a psychological matrix
- 2000Evaluating three-bar reversal reliability
- 2000Prior-day candles, open confirmation, and same-session stops
- 2000Intraday candlestick volume confirmation for daytrading
- 2001Count the key reversal up before coding a mechanical exit
- 2001Rising and falling three continuation candle construction
- 2002Treat a moving average as a contested fence
- 2003Candlestick signals need support and a risk-reward screen
- 2003Constructing one-day reversal tops and bottoms
- 2003Chart sentiment as a regime filter for hourly stochastic entries
- 2004Confirming index reversals with candlesticks, stochastics and averages
- 2004The harami inner close as a reversal barometer
- 2004Constructing a true-range volume power-shift filter
- 2005Weighing reversal clusters against moving-average support
- 2005Candlestick exits confirmed by overbought stochastics
- 2005Confirming piercing patterns with stochastics and moving averages
- 2006Candlestick cluster exits confirmed by overbought stochastics
- 2007Three black crows become a trade hypothesis only after regime, trend and nearby levels
- 2008Asymmetrical RSI lookbacks for divergence and candle confirmation
- 2008A permission checklist for the end of a trend
- 2010Mechanical entries still need confirmation gates
- 2010Crude oil as a case study in candlestick session reading
- 2010Gold weekly candles and the thousand resistance breakout
- 2010A three-layer gold chart drill from waves to candle confirmation
- 2011Why entry scans fail without trend filters
- 2011Price-zone oscillator trend-regime rules
- 2011A candlestick checklist before commodity entries
- 2013Step candle construction at price turning points
- 2013Two-bar step-candle construction
- 2014Small-range bars as a timed volume-climax hypothesis
- 2014Constructing volume-scaled candlestick charts
- 2015Weekly range midpoints as support and resistance
- 2015Constructing weekly body-midpoint pattern codes
- 2015Evaluating encoded candlestick sequence hypotheses
- 2015Constructing a breakout relative-strength index from two-day range candles
- 2016A three-gate classroom on hourly sterling
- 2016Fibonacci retracement as a pre-commitment stop map
- 2017Nine-zone filter for decade-level breakouts
- 2017Constructing pin-bar and inside-bar setups
- 2017Two-bar soldier and crow rules become a system only after filters and exits
- 2017Confirm a one-white-soldier or one-black-crow before entry
- 2018Session control from marubozu and engulfing geometry
- 2019Volume, acceleration, and candle filters on a completed double bottom
- 2019Sector-filtered candlestick scans and predrawn stops