2010issue C0812-17
A three-layer gold chart drill from waves to candle confirmation
A historical gold case study stacks Elliott wave structure, Fibonacci retracement checkpoints, and candlestick patterns on the same swing. This article reconstructs that workflow so the three layers form one falsifiable setup rather than three competing opinions.
- The source treats gold forecasting as a combination of Elliott wave, Fibonacci retracement, and candlestick patterns, not as a single-method call.
- Elliott wave theory, as used here, describes an eight-wave cycle split into a five-wave motive phase and a three-wave corrective phase.
- On the daily gold chart, a move from the 78% retracement through the 38% retracement of the first motive wave was treated as the signal that corrective wave 2 had begun.
- Editorial note: the three layers help only when they share one invalidation, such as wave 2 retracing more than 61.8% of the prior advance.
What this case study shows
This article is a case study: a worked historical example used to show how a method is applied, not a live forecast. The source presents gold forecasting as a three-method combination of Elliott wave, Fibonacci retracement, and candlestick patterns rather than any one method used alone.
The topic is waves and ratios, meaning wave counts and ratio checkpoints used to describe how a price swing is unfolding. The archive facts below describe that historical workflow on gold.
The three layers
Elliott wave, as used here, is a labeled sequence of motive and corrective swings used to map trend structure. The source states that Elliott wave theory describes an eight-wave cycle split into a five-wave motive phase and a three-wave corrective phase.
Fibonacci retracement supplies ratio-based pullback and extension levels used as checkpoints on a completed swing. Candlestick patterns are single-bar or multi-bar price formations used as confirmation or invalidation of a wave-and-ratio read.
Editorial reading: run the three layers in order on one swing. First label the motive or corrective structure. Then mark Fibonacci checkpoints on the completed wave. Then use candles only to confirm or throw out that read.
The gold chart in the archive
On the daily forex-gold chart in the source, the motive phase is described as driving gold to a historical high of $1,221 in December 2009. A corrective phase then lasts from December 2009 to February 2010.
The source dates the start of a new motive wave 1 to February 2, 2010. It describes a climb from a $1,040 low of about $100 to more than $1,140.
The source treats a move from the 78% retracement through the 38% retracement on that first wave as the signal that corrective wave 2 had begun. It also states a wave-count rule that corrective wave 2 should not retrace more than 61.8% of the prior advance.
A sidebar projection in the source calculates a top to wave 3 at 1246 using Elliott wave projections on XAUUSD. That figure belongs to the historical worksheet. It is not a present-day target.
Forex gold swings against the Fibonacci ladder on the 2009–10 triad chart
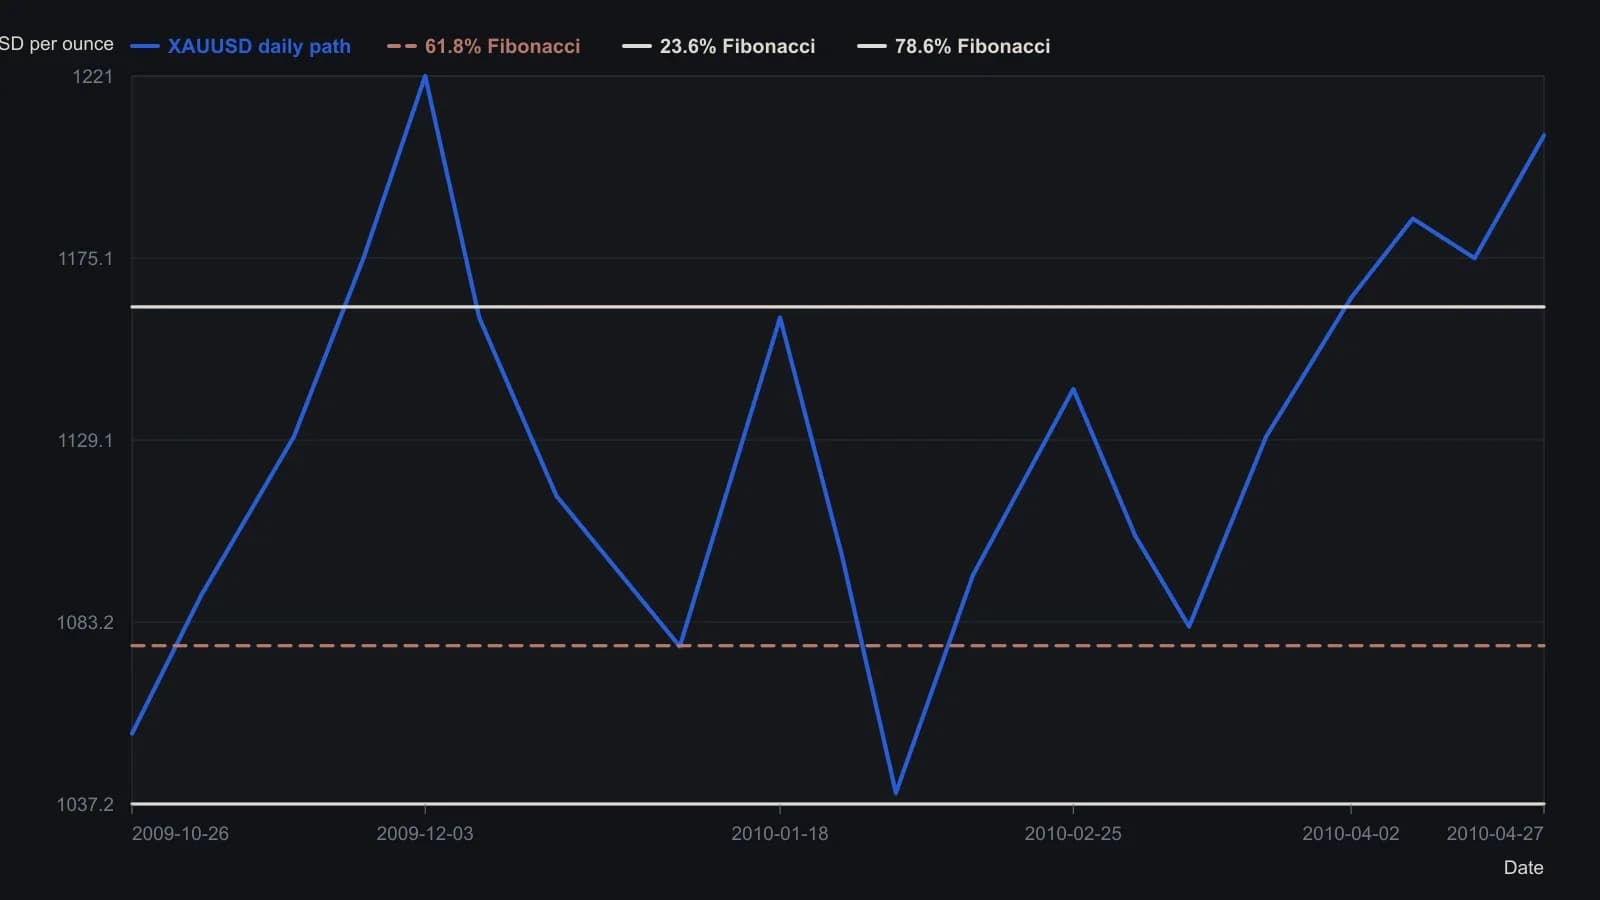
Intermediate closes are approximate to about five dollars. Wave B is placed just under the printed 23.6 percent line at 1,162.72. Dates for unlabeled swings follow the figure’s October 2009–April 2010 axis.
Editorial reading of the drill
Editorial reading: the falsifiable setup is the stacked drill, not a blend of leftover opinions. After wave 1 is labeled and measured, the Fibonacci map on that advance becomes the checkpoint list for wave 2. A move from the 78% retracement through the 38% retracement is the archive cue that wave 2 has started. The 61.8% rule is the line that would break the count.
Editorial reading: candlestick patterns sit last. A candle that holds the wave-and-ratio read keeps the setup intact. A candle that breaks the 61.8% invalidation, or that fails to support the wave 2 label, ends the setup. That is how three methods collapse into one hypothesis.
All readings on this track · 54 readings
- 1990Constructing three-session rally and reaction volume signals
- 1991Constructing candlestick real bodies and multi-session patterns
- 1991Treat a candlestick reversal as incomplete until %D confirms it
- 1991Filtering candlestick signals with stochastic percent-D
- 1991Constructing compressed candlestick summaries
- 1993Intraday candlestick confirmation with oscillators
- 1993Candlestick hypotheses from a 1993 reading list
- 1994License candlestick signals with oscillators and weekly vetoes
- 1995Real-body support, resistance, and close-through breakouts
- 1997Weekly reversal as a three-part hypothesis
- 1998Turning fear levels into testable rules with a psychological matrix
- 2000Evaluating three-bar reversal reliability
- 2000Prior-day candles, open confirmation, and same-session stops
- 2000Intraday candlestick volume confirmation for daytrading
- 2001Count the key reversal up before coding a mechanical exit
- 2001Rising and falling three continuation candle construction
- 2002Treat a moving average as a contested fence
- 2003Candlestick signals need support and a risk-reward screen
- 2003Constructing one-day reversal tops and bottoms
- 2003Chart sentiment as a regime filter for hourly stochastic entries
- 2004Confirming index reversals with candlesticks, stochastics and averages
- 2004The harami inner close as a reversal barometer
- 2004Constructing a true-range volume power-shift filter
- 2005Weighing reversal clusters against moving-average support
- 2005Candlestick exits confirmed by overbought stochastics
- 2005Confirming piercing patterns with stochastics and moving averages
- 2006Candlestick cluster exits confirmed by overbought stochastics
- 2007Three black crows become a trade hypothesis only after regime, trend and nearby levels
- 2008Asymmetrical RSI lookbacks for divergence and candle confirmation
- 2008A permission checklist for the end of a trend
- 2010Mechanical entries still need confirmation gates
- 2010Crude oil as a case study in candlestick session reading
- 2010Gold weekly candles and the thousand resistance breakout
- 2010A three-layer gold chart drill from waves to candle confirmation
- 2011Why entry scans fail without trend filters
- 2011Price-zone oscillator trend-regime rules
- 2011A candlestick checklist before commodity entries
- 2013Step candle construction at price turning points
- 2013Two-bar step-candle construction
- 2014Small-range bars as a timed volume-climax hypothesis
- 2014Constructing volume-scaled candlestick charts
- 2015Weekly range midpoints as support and resistance
- 2015Constructing weekly body-midpoint pattern codes
- 2015Evaluating encoded candlestick sequence hypotheses
- 2015Constructing a breakout relative-strength index from two-day range candles
- 2016A three-gate classroom on hourly sterling
- 2016Fibonacci retracement as a pre-commitment stop map
- 2017Nine-zone filter for decade-level breakouts
- 2017Constructing pin-bar and inside-bar setups
- 2017Two-bar soldier and crow rules become a system only after filters and exits
- 2017Confirm a one-white-soldier or one-black-crow before entry
- 2018Session control from marubozu and engulfing geometry
- 2019Volume, acceleration, and candle filters on a completed double bottom
- 2019Sector-filtered candlestick scans and predrawn stops